Just got a Protectli FW4C!
-
Actually scratch that part about the port forward. Now Home-->Main through a port forward is achieving good throughput:
[  6]   0.00-10.00  sec   681 MBytes   571 Mbits/sec                  sender
[  6]   0.00-10.00  sec   678 MBytes   568 Mbits/sec                  receiver
The reverse direction is better than it was 10 minutes ago, but still a fraction of the "good" direction:
[ 6] 0.00-10.00 sec 272 MBytes 228 Mbits/sec sender [ 6] 0.00-10.00 sec 272 MBytes 228 Mbits/sec receiver -
Ok, that's outside the tunnel though so it shows whatever the issue is it's probably nothing to do with the IPSec encryption/decryption.
You still see ~10ms latency between the sites? Consistently?
-
Yes, and this is pings to the LAN address of the opposite router, e.g. through the IPSec tunnel:
ping 192.168.1.1 -t

Pinging 192.168.1.1 with 32 bytes of data:
Reply from 192.168.1.1: bytes=32 time=8ms TTL=63
Reply from 192.168.1.1: bytes=32 time=8ms TTL=63
Reply from 192.168.1.1: bytes=32 time=8ms TTL=63
Reply from 192.168.1.1: bytes=32 time=8ms TTL=63
Reply from 192.168.1.1: bytes=32 time=8ms TTL=63
Reply from 192.168.1.1: bytes=32 time=8ms TTL=63
Reply from 192.168.1.1: bytes=32 time=8ms TTL=63
Reply from 192.168.1.1: bytes=32 time=8ms TTL=63
Reply from 192.168.1.1: bytes=32 time=8ms TTL=63
Reply from 192.168.1.1: bytes=32 time=8ms TTL=63
Reply from 192.168.1.1: bytes=32 time=8ms TTL=63

Ping statistics for 192.168.1.1:
    Packets: Sent = 11, Received = 11, Lost = 0 (0% loss),
Approximate round trip times in milli-seconds:
    Minimum = 8ms, Maximum = 8ms, Average = 8ms
and
ping 192.168.0.1
PING 192.168.0.1 (192.168.0.1): 56 data bytes
64 bytes from 192.168.0.1: icmp_seq=0 ttl=63 time=8.856 ms
64 bytes from 192.168.0.1: icmp_seq=1 ttl=63 time=8.497 ms
64 bytes from 192.168.0.1: icmp_seq=2 ttl=63 time=8.440 ms
64 bytes from 192.168.0.1: icmp_seq=3 ttl=63 time=8.968 ms
64 bytes from 192.168.0.1: icmp_seq=4 ttl=63 time=8.544 ms
64 bytes from 192.168.0.1: icmp_seq=5 ttl=63 time=8.557 ms
64 bytes from 192.168.0.1: icmp_seq=6 ttl=63 time=8.851 ms
64 bytes from 192.168.0.1: icmp_seq=7 ttl=63 time=8.557 ms
64 bytes from 192.168.0.1: icmp_seq=8 ttl=63 time=8.494 ms
64 bytes from 192.168.0.1: icmp_seq=9 ttl=63 time=8.644 ms
64 bytes from 192.168.0.1: icmp_seq=10 ttl=63 time=8.475 ms
64 bytes from 192.168.0.1: icmp_seq=11 ttl=63 time=8.740 ms
64 bytes from 192.168.0.1: icmp_seq=12 ttl=63 time=8.438 ms
64 bytes from 192.168.0.1: icmp_seq=13 ttl=63 time=8.943 ms
^X^C
--- 192.168.0.1 ping statistics ---
14 packets transmitted, 14 packets received, 0.0% packet loss
round-trip min/avg/max/stddev = 8.438/8.643/8.968/0.184 ms
I'm stumped as to what could cause performance to be so different in different directions.
-
Something in the route throttling it probably.
-
@stephenw10 said in Just got a Protectli FW4C!:
Something in the route throttling it probably.
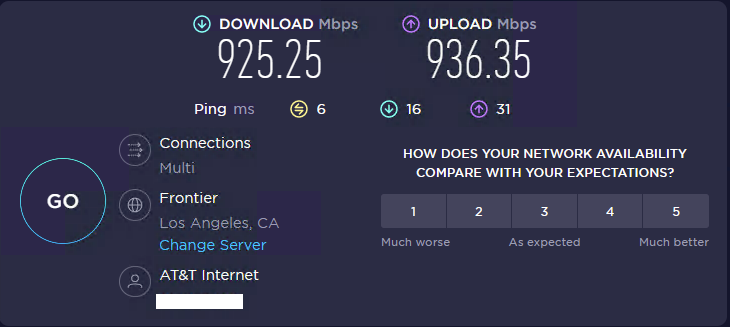
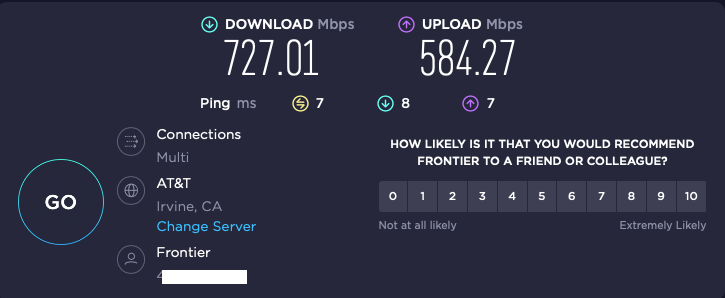
I'm going to take this up with AT&T (main office, business fiber), as I don't think Frontier (home office, residential fiber) will care. Someone on another group mentioned the peering agreements between the two ISPs, but I ran this test just now.
Here's Speedtest from AT&T in my Main Office, with Frontier manually selected as the Speedtest server:

and from my Frontier in my home office, with AT&T auto-selected as the "optimal" Speedtest server:

-
@thewaterbug its completely possible there were route issues in the path. failing link, errors, etc.
When i had similar issues in the past, ive used mtr to seee the path. At times it was noticble that there was a problem othertimes not.Without additional probing at each site its impossible to tell.
I do use gateway monitoring and set the monitor IP to the remote end of either the tunnel address or the physical interface address. Might find something interesting. -
@michmoor said in Just got a Protectli FW4C!:
@thewaterbug its completely possible there were route issues in the path. failing link, errors, etc.
When i had similar issues in the past, ive used mtr to seee the path.Here's WinMTR from the main office back to my home office:
|------------------------------------------------------------------------------------------|
|                                      WinMTR statistics                                   |
|                       Host              -   %  | Sent | Recv | Best | Avrg | Wrst | Last |
|------------------------------------------------|------|------|------|------|------|------|
|                             192.168.0.1 -    0 |   85 |   85 |    0 |    0 |    0 |    0 |
|ispgtway.lightspeed.irvnca.sbcglobal.net -    0 |   85 |   85 |    0 |    0 |    1 |    0 |
|                      Request timed out. -  100 |   18 |    0 |    0 |    0 |    0 |    0 |
|                          64.148.105.208 -    0 |   85 |   85 |    2 |    2 |    3 |    2 |
|                            12.242.115.3 -    0 |   85 |   85 |    4 |    6 |   10 |    5 |
|   be3013.ccr41.lax05.atlas.cogentco.com -    0 |   85 |   85 |    4 |    5 |   25 |    4 |
|   be3059.ccr42.lax01.atlas.cogentco.com -    0 |   85 |   85 |    4 |    4 |    6 |    5 |
|be219.rcr21.b40.lax01.atlas.cogentco.com -    0 |   85 |   85 |    5 |    5 |    7 |    5 |
|                            38.88.245.26 -    0 |   85 |   85 |    4 |    7 |   33 |    8 |
|   ae1---0.cbr06.lsan.ca.frontiernet.net -    3 |   77 |   75 |    5 |    5 |    6 |    5 |
|  be10---0.lcr22.lsan.ca.frontiernet.net -    0 |   84 |   84 |    7 |   11 |   15 |   13 |
|xe-8-1-2-0.fdr01.rlhl.ca.frontiernet.net -    0 |   84 |   84 |    8 |   11 |   59 |   12 |
|                      Request timed out. -  100 |   17 |    0 |    0 |    0 |    0 |    0 |
|                      Request timed out. -  100 |   17 |    0 |    0 |    0 |    0 |    0 |
|                      Request timed out. -  100 |   17 |    0 |    0 |    0 |    0 |    0 |
|                      Request timed out. -  100 |   17 |    0 |    0 |    0 |    0 |    0 |
|                      Request timed out. -  100 |   17 |    0 |    0 |    0 |    0 |    0 |
|                      Request timed out. -  100 |   17 |    0 |    0 |    0 |    0 |    0 |
|                      Request timed out. -  100 |   17 |    0 |    0 |    0 |    0 |    0 |
|                      Request timed out. -  100 |   17 |    0 |    0 |    0 |    0 |    0 |
|                      Request timed out. -  100 |   17 |    0 |    0 |    0 |    0 |    0 |
|                      Request timed out. -  100 |   17 |    0 |    0 |    0 |    0 |    0 |
|                      Request timed out. -  100 |   17 |    0 |    0 |    0 |    0 |    0 |
|                      Request timed out. -  100 |   17 |    0 |    0 |    0 |    0 |    0 |
|                      Request timed out. -  100 |   17 |    0 |    0 |    0 |    0 |    0 |
|                      Request timed out. -  100 |   17 |    0 |    0 |    0 |    0 |    0 |
|                      Request timed out. -  100 |   17 |    0 |    0 |    0 |    0 |    0 |
|                      Request timed out. -  100 |   17 |    0 |    0 |    0 |    0 |    0 |
|                      Request timed out. -  100 |   17 |    0 |    0 |    0 |    0 |    0 |
|                      Request timed out. -  100 |   17 |    0 |    0 |    0 |    0 |    0 |
|________________________________________________|______|______|______|______|______|______|
   WinMTR v1.00 GPLv2 (original by Appnor MSP - Fully Managed Hosting & Cloud Provider)
and MTR from my home office back to the main:
Keys: Help Display mode Restart statistics Order of fields quit Packets Pings Host Loss% Snt Last Avg Best Wrst StDev 1. home.routers.host.name 0.0% 97 1.1 1.9 1.0 10.5 1.9 2. home.isp.default.gateway 0.0% 97 8.2 4.8 1.4 40.6 5.6 3. te1-7-0-4---0.lcr01.lsan.ca.frontiernet.net 0.0% 97 6.7 6.0 2.5 25.4 3.5 4. ae8---0.scr01.lsan.ca.frontiernet.net 50.5% 97 3.2 4.6 2.7 29.4 4.2 5. ae0---0.cbr05.lsan.ca.frontiernet.net 1.0% 97 29.3 9.1 3.5 34.7 6.9 6. lag-101.ear2.losangeles1.level3.net 96.9% 97 9.6 13.0 2.7 26.7 12.3 7. ae1.3510.edge1.tustin1.level3.net 0.0% 97 12.2 10.2 4.8 90.2 10.2 8. 192.205.37.145 0.0% 97 12.3 12.1 7.0 51.9 5.5 9. cr1.la2ca.ip.att.net 1.0% 97 12.5 13.6 7.4 36.9 4.9 10. gar5.lsrca.ip.att.net 0.0% 96 9.4 10.7 6.9 36.6 4.4 11. (waiting for reply) 12. 75.20.1.78 1.0% 96 32.2 8.4 5.9 32.3 4.8 13. 75.20.0.115 95.8% 96 6.8 6.9 6.8 7.2 0.2 14. 64.148.105.209 0.0% 96 7.7 10.3 7.6 37.3 5.5 -
Is there anyone on this thread in the greater LA area that could run iperf and iperf -R to my server? I can port-forward through my firewall. Please PM me if you can. Thanks!
-
@thewaterbug said in Just got a Protectli FW4C!:
I'm stumped as to what could cause performance to be so different in different directions.
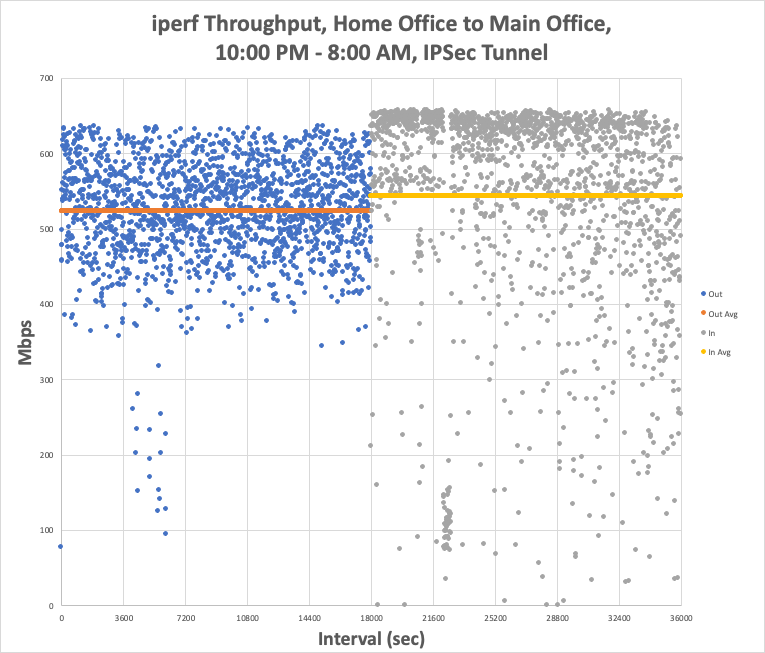
It looks like this was a unit failure. The FW4C unit in my Home Office was shutting off from time to time, and with increasing frequency. I opened a ticket with Protectli, and they advance-shipped me a new one, no questioned asked, without even requiring a credit card. The replacement unit is now in place at my Home Office, with the same configuration, and here's the result of 5 hours in each direction, sequentially, and this time it's through the tunnel, and not through a port-forward:
./iperf3 -w 4M -c 192.168.0.56 -t18001s | tee iperfout.txt && sleep 60 && ./iperf3 -w 4M -c 192.168.0.56 -t18001s -R | tee iperfin.txt
Home-to-Main (Out) averaged 524 Mbps with peaks as high as 639 Mbps, and Main-to-Home (In) averaged 544 Mbps with peaks as high as 661 Mbps. Moreover, the speeds now have a much tighter distribution, and look much more like "the Internet," with the inbound nearing some sort of limit at the mid-600s.
So this is all great news. When I started this I had reasonable expectations, and told myself I'd be happy with sustained throughput of 500 Mbps, and I'm getting that. Tonight I may repeat this through a port-forward, just to see how much the tunnel impacts throughput.
I am a bit puzzled, though, because when I put the two units side by side on my bench, with just a cable linking the WAN ports at 2.5GBaseT and no Internet, I was able to get 620 Mbps through the tunnel (I didn't think to test through a port-forward at that time). I'm having a hard time figuring out how a misbehaving unit would test reasonably well on the bench but then fail only when the internet enters the picture.
Once I have some demonstrated uptime (so I can close my ticket with Protectli for the failing unit), I may swap my SG-1100 back into place and bring the new Home Office FW4C back into the office, right next to the Main Office unit, and test WAN-to-WAN throughput again over a simple cable, both through the tunnel and through a port forward.
It's been only 36 hours on the replaced unit, but I'm now really happy with my purchases, and with Protectli support. I'm going to lob a question into their engineer about how he got 980 Mbps on his bench.
-
Different hardware/firmware revision on the NICs maybe?
-
I don't think so, because it's a brand new product.
There was definitely something wrong with the unit that I swapped out, because it was spontaneously shutting itself down.
-
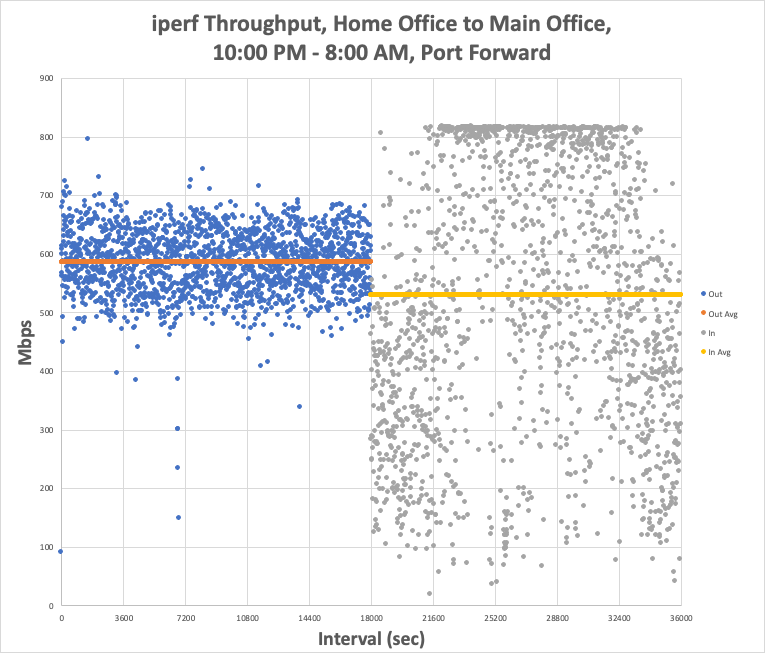
Here's the port-forward test:

Outbound averaged 586 with a max of 812. Inbound averaged 530 with a max of 825.
-
T TheWaterbug referenced this topic on
-
T TheWaterbug referenced this topic on