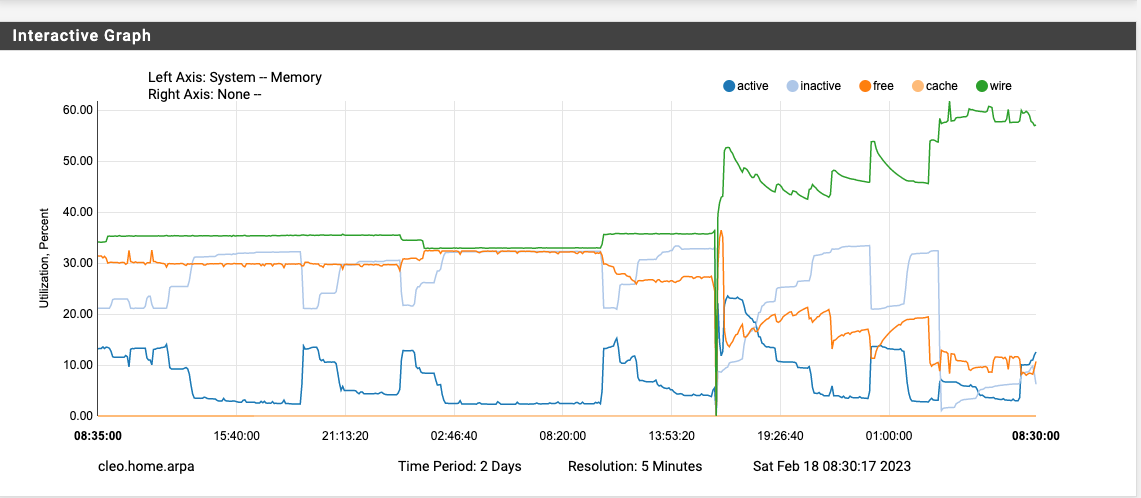
1100 upgrade, 22.05->23.01, high mem usage
-
Same thing here.
22.05, with pfblockerng and RAM disk, I was using around 600MB, thus around 1400MB free.23.01 without pfblockerng:
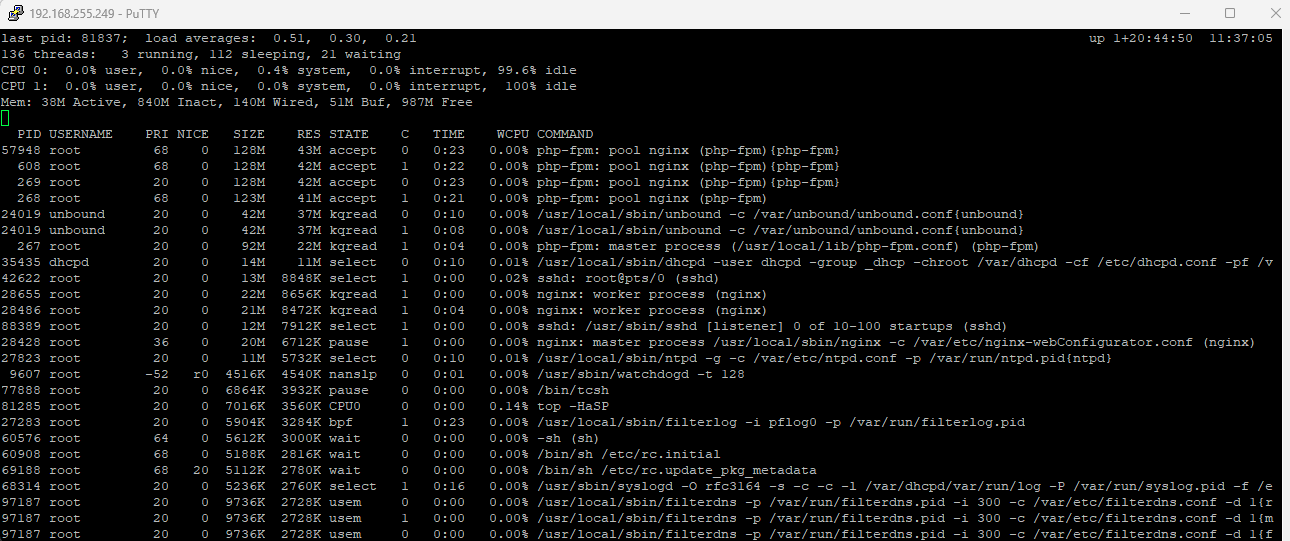
And note that SG-3100 uses UFS and not ZFS.
-
@bigsy said in 1100 upgrade, 22.05->23.01, high mem usage:
@defenderllc I raised something similar on the 23.01 devel forum last week.
In the absence of an obvious memory hogging culprit, ZFS ARC may be accounting for the increase in wired memory and this is considered 'harmless' as it can be freed up as the system requires.
Thank you. It’s currently hovering at 34% and has been at that state all morning. When I looked late last night it was around 22%. I’ll keep an eye on it. Thanks again.
-
Yes, my 1100 is ZFS and I do use pfblockerng (I changed from _devel to regular version after the upgrade, still ended up at version 3.x, whew).
I don't want to be forced into "reboot every X days to keep it running", so I hope there isn't a real problem here.
Apologies for posting this in "installation and upgrade" and then reposting in general discussions too. I tried to delete my post here and it would not let me.
-
@beerguzzle said in 1100 upgrade, 22.05->23.01, high mem usage:
Yes, my 1100 is ZFS and I do use pfblockerng (I changed from _devel to regular version after the upgrade, still ended up at version 3.x, whew).
I don't want to be forced into "reboot every X days to keep it running", so I hope there isn't a real problem here.
Apologies for posting this in "installation and upgrade" and then reposting in general discussions too. I tried to delete my post here and it would not let me.
I need to do the same for pfBlocker. My experiences are the same as yours so far…
-
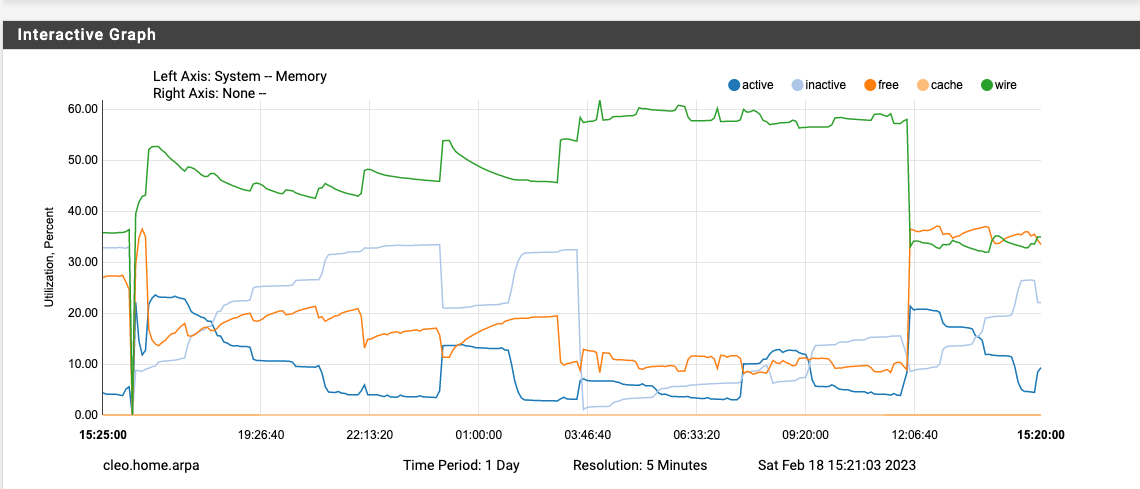
Thanks to bigsy and others for clues here. I rebooted at noon today, about 22 hours after the 23.01 upgrade. The reboot seems to have cured the high memory usage, see the chart below. The first dive at the far left is the upgrade action. The middle of the chart is the high mem usage after the upgrade, followed by the reboot at noon and a normal chart thereafter.
-
My 6100 MAX seems to have stabilized after at least 4 or 5 reboots since the upgrade when it first went GA. The only difference this time is that I uninstalled pfBlockerNG-DEV and reinstalled the normal version. Will continue to monitor.
-
 J jimp moved this topic from Problems Installing or Upgrading pfSense Software on
-
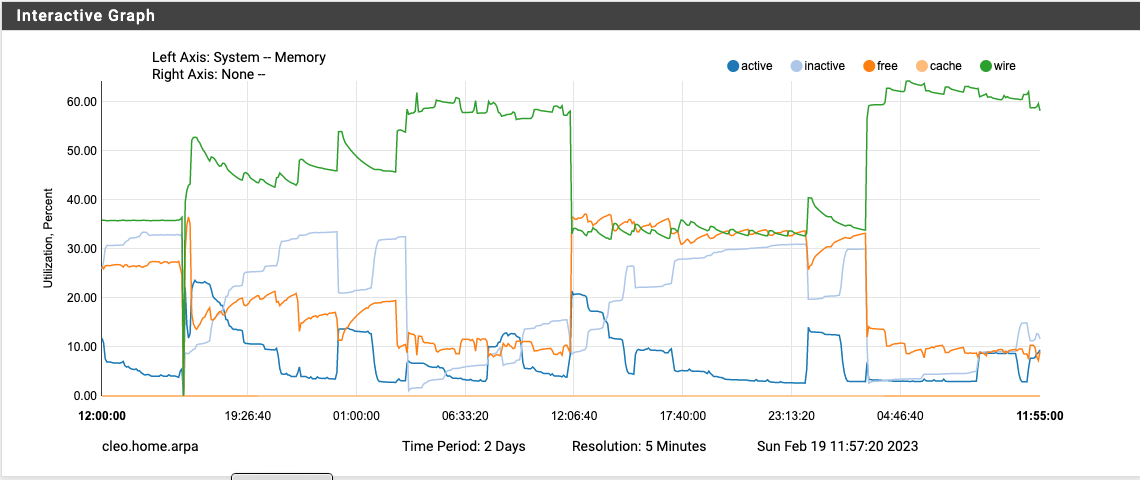
My mem usage jumped up at precisely 3 AM this morning, when the cron job scripts in /etc/periodic/daily fired off. Something in these scripts caused "unbound" to return to its 179M of resident memory again. To answer questions, yes I do use DNSBL in pfblockerng, with DNSBL groups Easylist and ADs_basic. For DNS over HTTPS, I block Firefox and Google in that list. I also pull in the ASNs for Facebook, to block them in/out all ports.
Here is my mem graph at the moment. The first dip was the upgrade, the second was my reboot at noon yesterday. The big jump was the 3 AM cron job. At this point, I'm going to leave it alone and keep an eye on the memory over the coming days (and hope it doesn't croak).
-
@beerguzzle said in 1100 upgrade, 22.05->23.01, high mem usage:
My mem usage jumped up at precisely 3 AM this morning, when the cron job scripts in /etc/periodic/daily fired off. Something in these scripts caused "unbound" to return to its 179M of resident memory again. To answer questions, yes I do use DNSBL in pfblockerng, with DNSBL groups Easylist and ADs_basic. For DNS over HTTPS, I block Firefox and Google in that list. I also pull in the ASNs for Facebook, to block them in/out all ports.
Here is my mem graph at the moment. The first dip was the upgrade, the second was my reboot at noon yesterday. The big jump was the 3 AM cron job. At this point, I'm going to leave it alone and keep an eye on the memory over the coming days (and hope it doesn't croak).

Same here. Thought my 6100 was stabilized, it hasn’t left 35% since I woke up this morning…. Over double than 22.05.
-
Same here on my 1100. I had to do a fresh install after the upgrade locked it up. I have a very basic config with ZFS and a few openVPN tunnels. After a reboot the memory starts out around 29% and in the course of a day is running at 85%
This sort of problem makes me think twice about spending the extra money to buy netgate hardware.
Roy...
-
Mine is a 2100 and I've noticed that something around 3 am is causing a change (and not giving it back) until I reboot.
Everything left of the red line is 22.05 every right after the update to 23.01
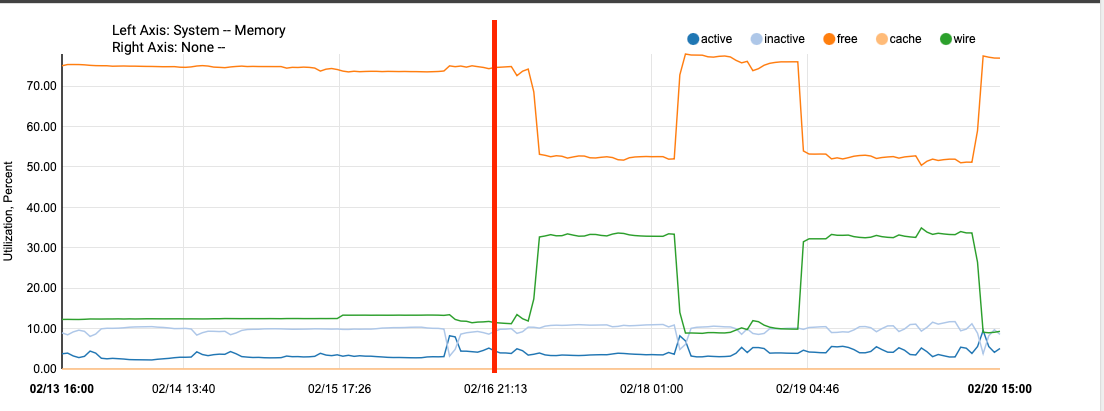
once it changes it stays at the new level even if passing through a second 3am. It does NOT add "more" to the memory footprint on passing a second 3am. just stays right about there.
Not too worried about it in my case because the changes are pretty static. But yes it appear that a 3am there is something causing a spike that doesn't really give it back, or take more next time.
-
@jrey said in 1100 upgrade, 22.05->23.01, high mem usage:
Mine is a 2100 and I've noticed that something around 3 am is causing a change (and not giving it back) until I reboot.
Everything left of the red line is 22.05 every right after the update to 23.01

once it changes it stays at the new level even if passing through a second 3am. It does NOT add "more" to the memory footprint on passing a second 3am. just stays right about there.
Not too worried about it in my case because the changes are pretty static. But yes it appear that a 3am there is something causing a spike that doesn't really give it back, or take more next time.
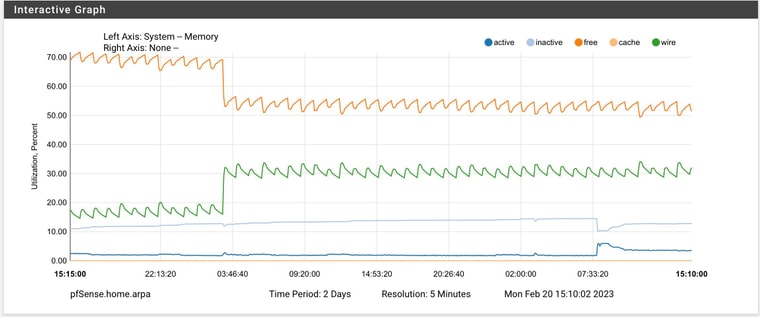
My 6100 is doing the exact same thing around 3AM and not giving it back. This is the last 2 days:
-
R rpsmith referenced this topic on
-
 J johnpoz referenced this topic on
-
@rpsmith said in 1100 upgrade, 22.05->23.01, high mem usage:
This sort of problem makes me think twice about spending the extra money to buy netgate hardware.
Roy...
To be fair, what you are seeing is not related to netgate appliances, but something in 23.01 (software) that does not release memory as intended. It does look like it does not claim even more memory at next run (so there is reuse going on at 3:00am).
But this needs to fixed in software, not hardware.
-
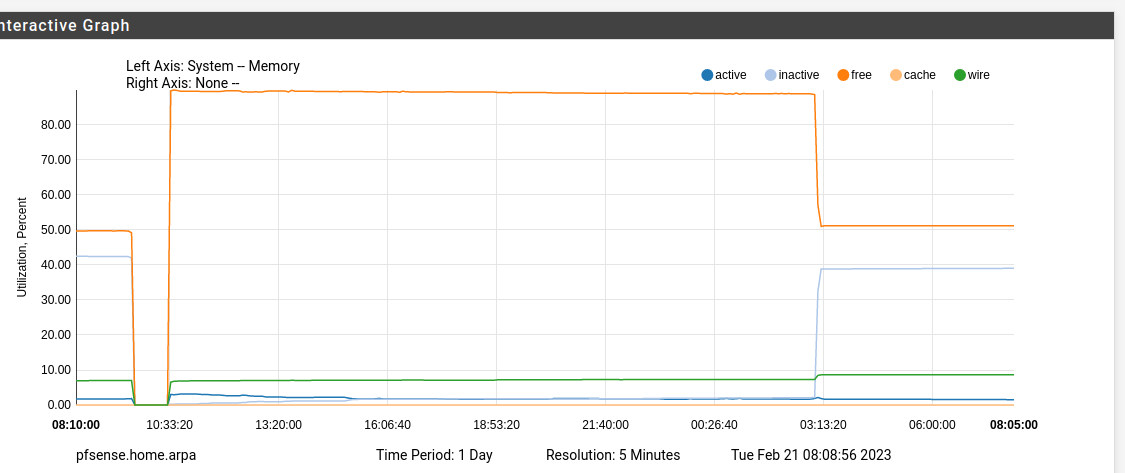
This graph is from a SG-3100, which uses UFS and not ZFS.
I only installed Acme package in it. -
Not convinced it is Acme, on my system that is schedule for 3:16 the change happens at 3:00 through 3:10
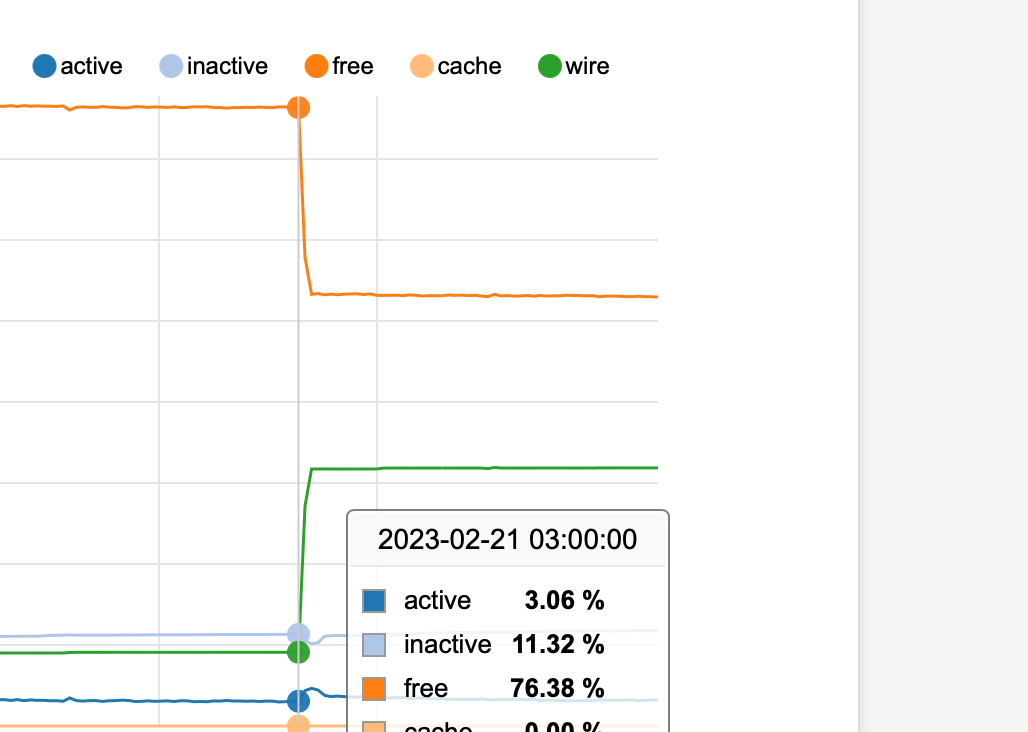
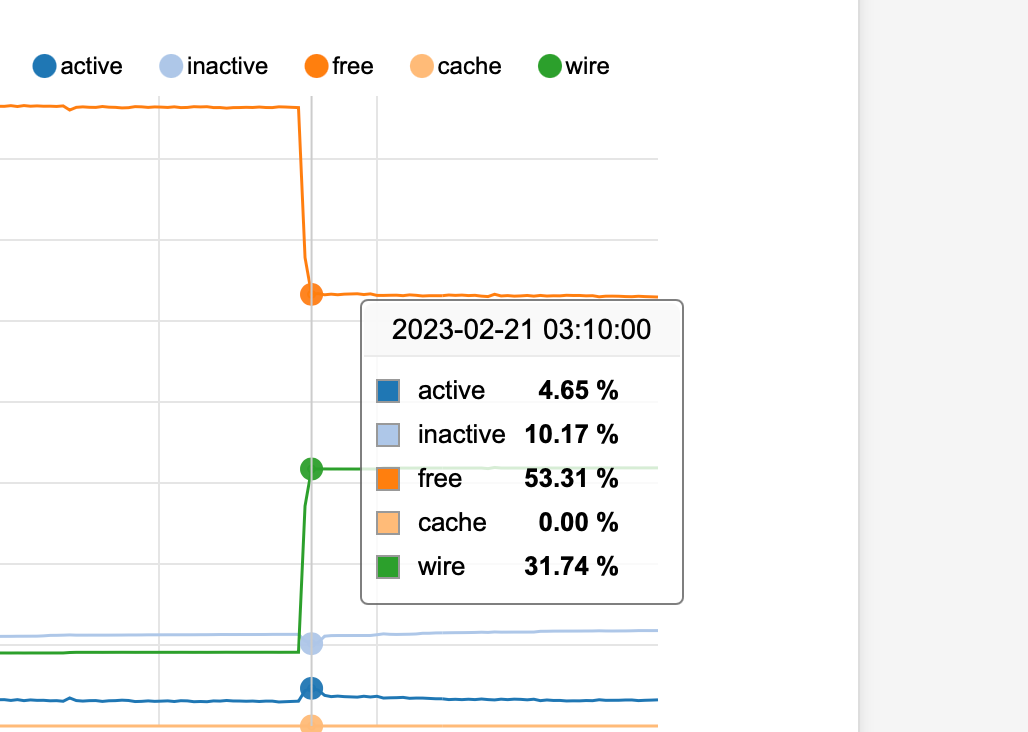
couple of items I see starting at exactly 3:00 are
the section Rotate log files every hour, if necessary.
the entry "newsyslog"the Section perform daily/weekly/monthly maintenance.
the entry for "periodic daily"and under the section
pfSense specific crontab entries
Created: February 19, 2023, 8:06 pm
the entry for "/etc/rc.periodic daily"Everything else at the 3 hour either has multiple minutes (like 1,31) or a specific mday.
So think here is one of those two maintenance routines, rotation of the logs should be fairly boring.
I might move one of the periodic daily to say hour 2 (nothing else specifically scheduled there on my system) and see if the memory change then aligns to the one or the other.i want to check first and see if the two have to run at the same time for some reason, because the "weekly" and "monthly" run at paired times as well.
-
@jrey So, its not acme, its not ZFS (because UFS system is also affected), its not pfblockerng/snort/suricata since I don't have those installed and I'm facing the same problem around the same time as you guys.
I'm not sure if this is related to logs since I'm not writing anything to the disk (remote syslog):
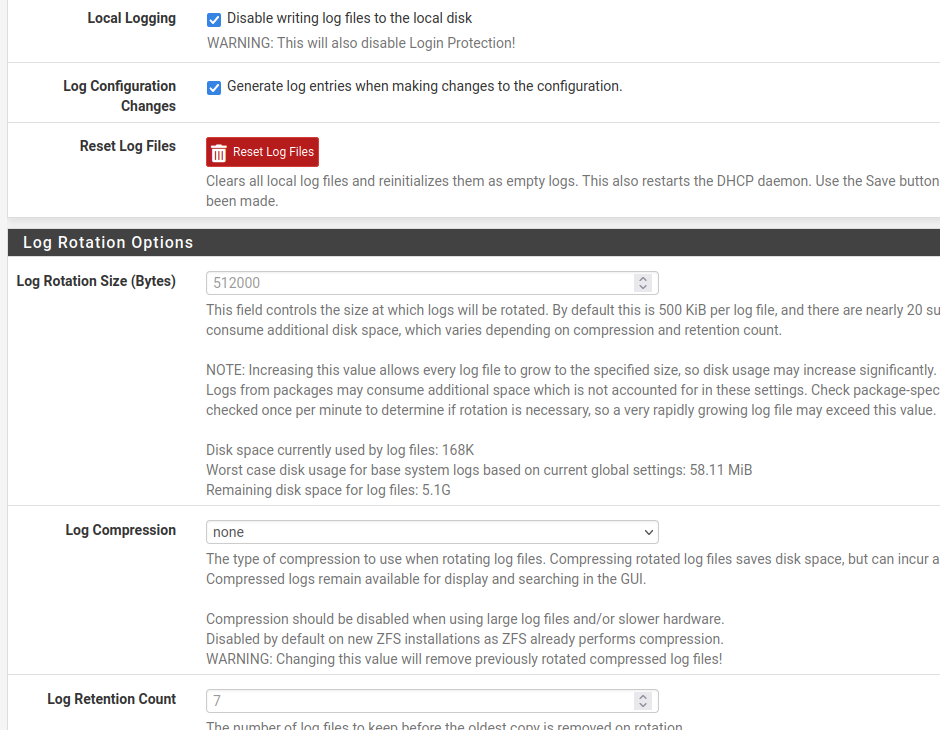
-
After leaving things alone for a couple of days, the mem usage jumps to about 63% at 3 AM and slowly drops over the next 24 hours to about 53%, then jumps back to 63%. So it is "stable" between these two numbers. I have had no ill effects of this new memory usage since going to 23.01.
Thinking that "unbound" might be holding more DNS cache info than it needs, and that it might be a DNS cache timeout issue, I looked around there in Services->DNS Resolver->Advanced. My "TTL for host cache entries" is 15 minutes, and the "Max TTL for RRsets" is one day. Hmmm. I wonder if I reduced the Max TTL if anything good or bad would happen. I nervous about futzing with anything here.
-
Only difference I have in those settings is the local logging is unchecked for me. Even though I also send to a syslog
Log rotation is generally such a trivial task, I can't see it running for the 10 minutes (in my case)
to me the periodic daily are more likely the cause of the slow, one time over the 10 minutes memory burn.
Now, if left alone at this point it won't change anymore. It will just stay at these new levels. (pretty flat line 1-2% bumps up/down here and there, but nothing near the level of the first 3am after a restart)
based on the before/after upgrade graph or even after a reboot
a) the system isn't very memory stressed (I only have about 45-50 devices behind it)
b) this has only started since the upgrade and is consistent at only happening the first 3am cycle after a restart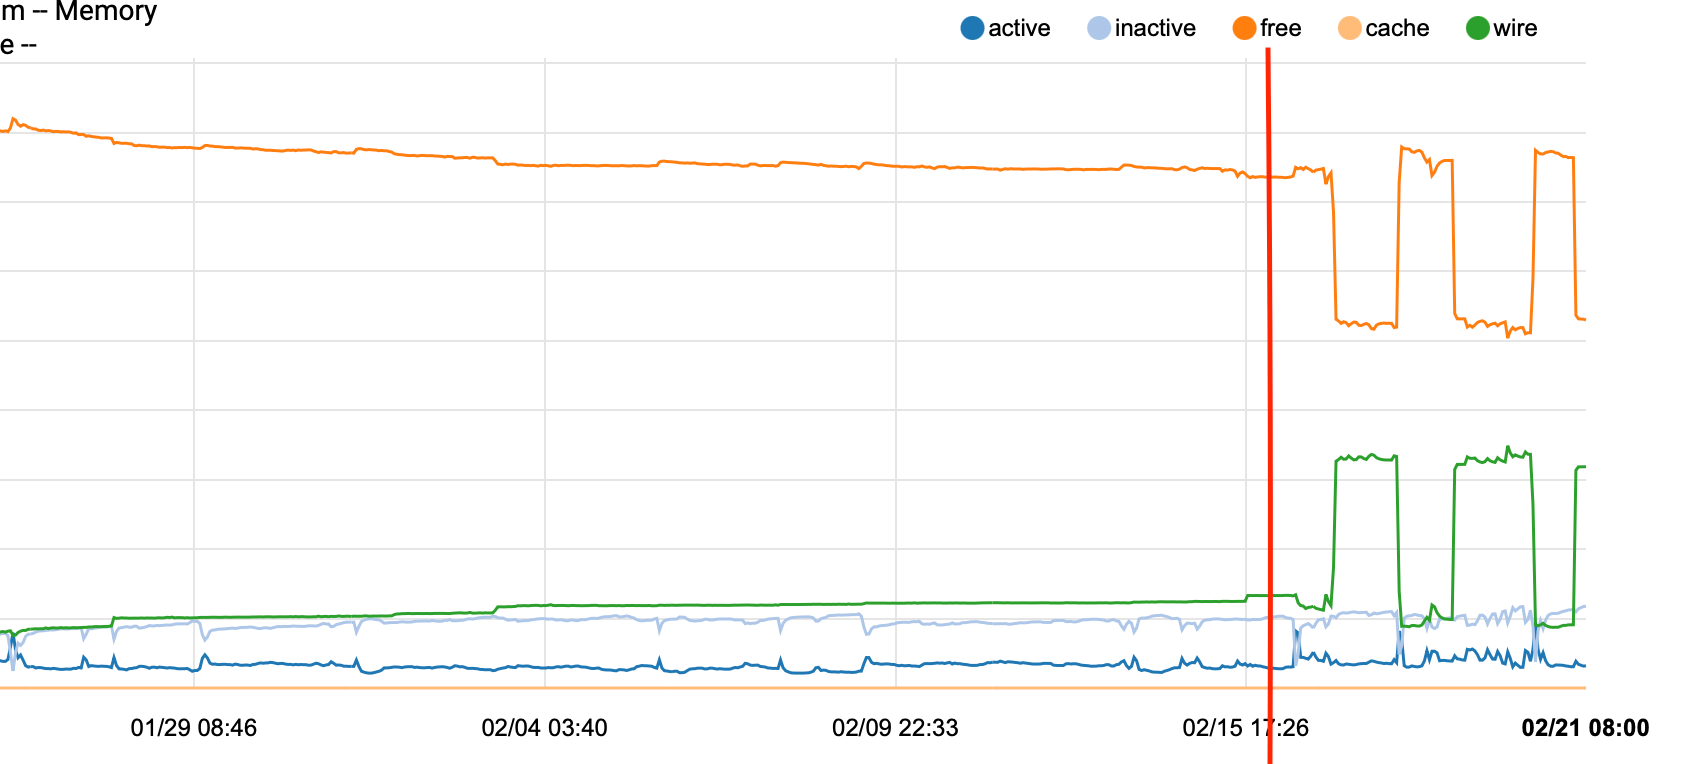
Red line left of is 22.05 to the right is 23.01
pretty obvious when this was introduced. -
I would think if this were DNS related, memory would fluctuate more often and be less flatline, as has been shown at least in my case where the change is only at first 3am after a reboot.
For the record I don't run DHCP on this NG, that is handled by one of the internal systems for all devices on the network. All devices on LAN point to it for DNS (primarily for pfBlockerNG) but the NG forwards all missing requests to 2 (AD paired DNS systems, both of which have the ability to reach "outside" if they don't have the answer. But neither of the 2 DNS servers accept queries coming in.I'm supporting about 45-50 systems behind the 2100. and typically the memory is 10-15% until at 3am it jumps to 37%-%40 typically after the restart yesterday it was at 12% this morning 39% and it will stay right about there until the next restart.
Not concerned, just more of an observation.
JR -
FYI, there's now package updates available for pfBlockerNG and Suricata. Perhaps this will help.
-
@beerguzzle I posted in similar thread https://forum.netgate.com/topic/177886/23-1-using-more-ram/41. Based on my second day it should not increase again, it's just the first day after reboot from what I see.
