Just purchased a Netgate 8200 -- having a few issues.
-
I just purchased an 8200 to replace a higher-end DIY build I threw together on a temporary basis.
The first (and foremost) issue that I've encountered is that I am not able to achieve 10Gb/s to my ISP's speedtest server, however on my old system I was able to without issue. I typically get about 3-5Gb/s of download throughput on the 8200 compared to easily maxing out my connection at a full 9.8/9.9Gb/s up and down before I put the 8200 in.
I have extremely minimal firewall rules configured (less than on my old system), and I do not appear to be CPU-bound -- as I run a speed test, the 8200's CPU does not seem to get above 25-30%. All network hardware (including the SFP+ and cabling) are identical to the old system, nothing changed on the client system performing the tests. No packages worth mentioning installed (literally just "Patch Manager" and "pimd" but the throughput issue pre-dates installation of pimd).
At first I thought "well duh, the old system was a much higher end CPU" but as stated above, I do not appear to be maxing out the CPU and the 8200 is advertised as being able to push 18 Gb/s of firewalled traffic. Something isn't right and I'm wondering how I would go about troubleshooting this further.
Second... for the life of me, I cannot get my HENETv6 tunnelbroker tunnel to function no matter what I do. The tunnel interface comes up and I am able to successfully ping the far-end IPv6 address from SSH, but the Gateway/Gateway Groups can never satisfactorily see it as "up" with successful pings -- it's always in Pending or Down status. Even if I force the monitoring up (to ignore the ping testing), when I fail over to it, it will not pass any real v6 traffic. I've re-checked every guide and doc online for setting up the tunnel and everything seems right, I'm unsure of how to further debug this.
Any help would be greatly appreciated; I'm having one other minor issue w/miniupnpd log spamming about interface index numbers, but that issue was in my old system and I naïvely thought I full clean install on new hardware would resolve that. There's grumblings in redmine from years and versions past about the issue, but evidently it's never been fully resolved. :-/ Is there any way to squelch the log spam? ("yeah, don't use UPnP" is not an option for me, unfortunately)
Edit: Ok, scratch the thing about the HENET tunnel. After comparing my old config.xml to my new config.xml and seeing no relevant differences, a good ol' fashion "Enable/Disable" in the UI did it. Puzzling since I know I rebooted the whole box a handful of times troubleshooting previously. :-/
-
This post is deleted! -
Check the per core loading hen running a test by running at the command line:
top -HaSP.What exactly is the UPnP error you're seeing? How is UPnP configured?
Were you able to resolve the pkg install issue? There was an IPv6 connectivity issue at the pkg servers earlier that you might have been hitting. pfSense will try to use IPv6 by default if it has a routable address and that causes delays if it cannot use it.
Steve
-
@stephenw10 said in Just purchased a Netgate 8200 -- having a few issues.:
Check the per core loading hen running a test by running at the command line:
top -HaSP.What exactly is the UPnP error you're seeing? How is UPnP configured?
Were you able to resolve the pkg install issue? There was an IPv6 connectivity issue at the pkg servers earlier that you might have been hitting. pfSense will try to use IPv6 by default if it has a routable address and that causes delays if it cannot use it.
Steve
Thanks for the response. Yeah I tried to delete my post about the package install issue, appears it's just greyed-out. I think I might've been hitting that IPv6 issue, was it also happening last night (say around 12a-2a EDT)? heh Unclear when the v6 issue resolved, but I eventually realized I forgot to run option 13 from the CLI. After I did that, everything was working and I was able to install iperf3.
I ran the per-core top, and I did testing w/-P 5 on my iperf3 client and I'm able to achieve around 3.5Gb/s total actually. I can see a couple cores occasionally maxing out, but not everything:

The miniupnpd log spam issue ... I brought to the Routing & Multi-WAN forum and ressurected an old topic from 2021 (which seemed to be the newest one discussing it in these forums), but it's basically the log spam that numerous people on reddit, these forums, and even redmine (in years past) have complained about. The dozens+ of errors about invalid indexes that are spammed into the logs every minute or less. Might have to do with when you select multiple LANs, because there is some indication that it's relating to whether or not the syntax in the config file has to list one interface per line, or all on the same line separated by spaces. If I manually edit the file to make them all on one line separated by spaces, I lose the index errors but then it errors out as if the UPnP requests from the other LANs are foreign/"not LAN".
Thread is here: https://forum.netgate.com/topic/182556/is-there-an-actual-miniupnpd-log-spam-solution
-
Ok, so you can see 3 cores there that 0% idle, effectively 100% used. One of those things will be limiting you.
What I think it actually is though is that you're running iperf3 (which is intentionally single threaded) on the firewall itself. pfSense is not a good server it's optimised as a router. The 3Gbps you're seeing is just what 1 CPU core can push. Try testing through it if you can.
Steve
-
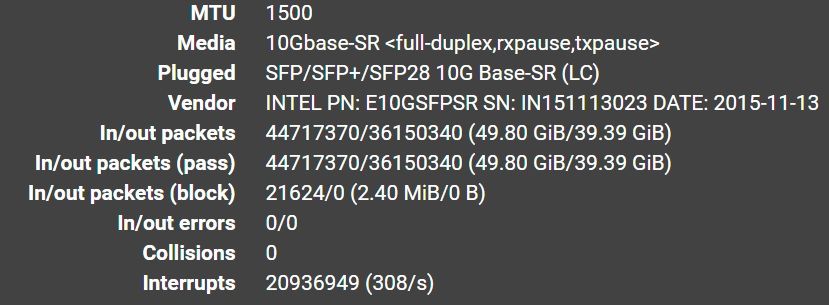
@stephenw10 Ok, so as with running iperf3 on the firewall, generally what I'm still seeing is 2-3 cores pegged @ 100% (0% idle) during either a download or an upload speed test and "consistently inconsistent" speed test results in both directions. I did just click through about fifteen speed tests, but could these 'Interrupts' be an issue on my WAN interface statistics (this is my 10G link / primary default GW):
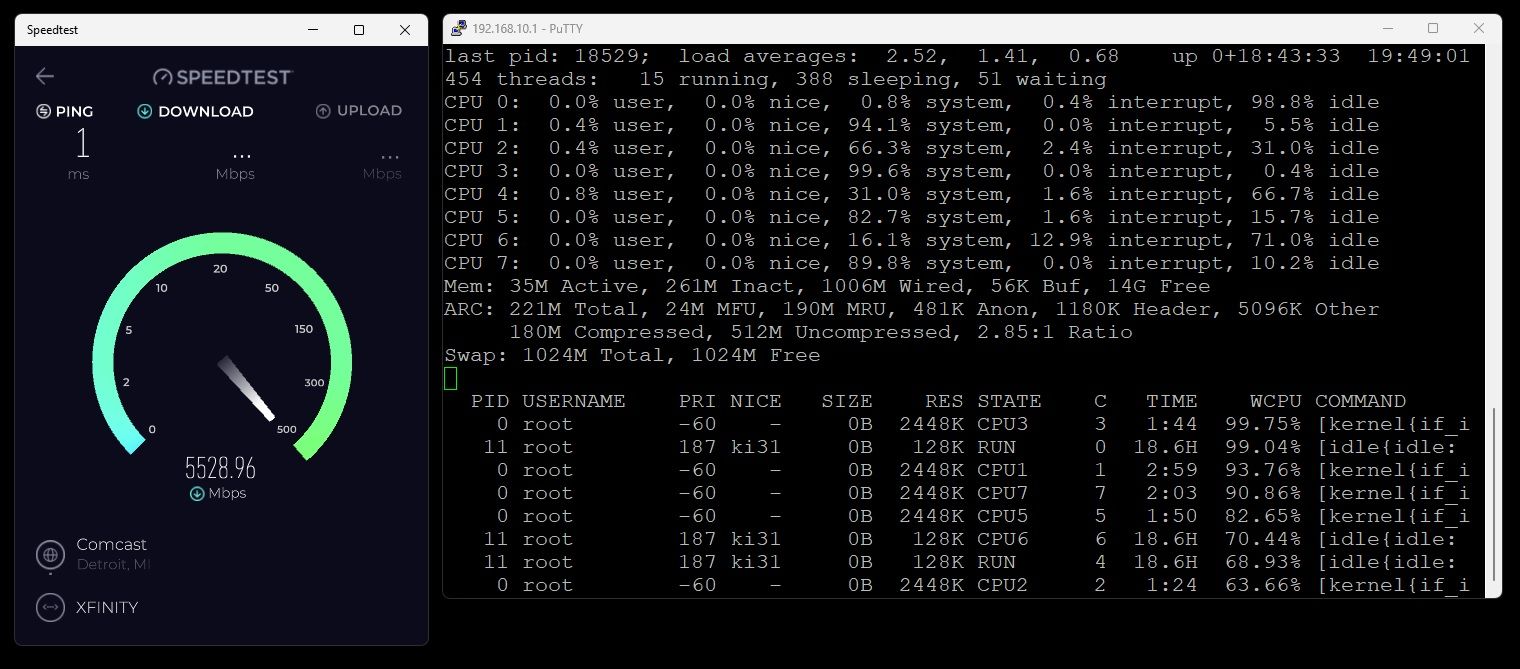
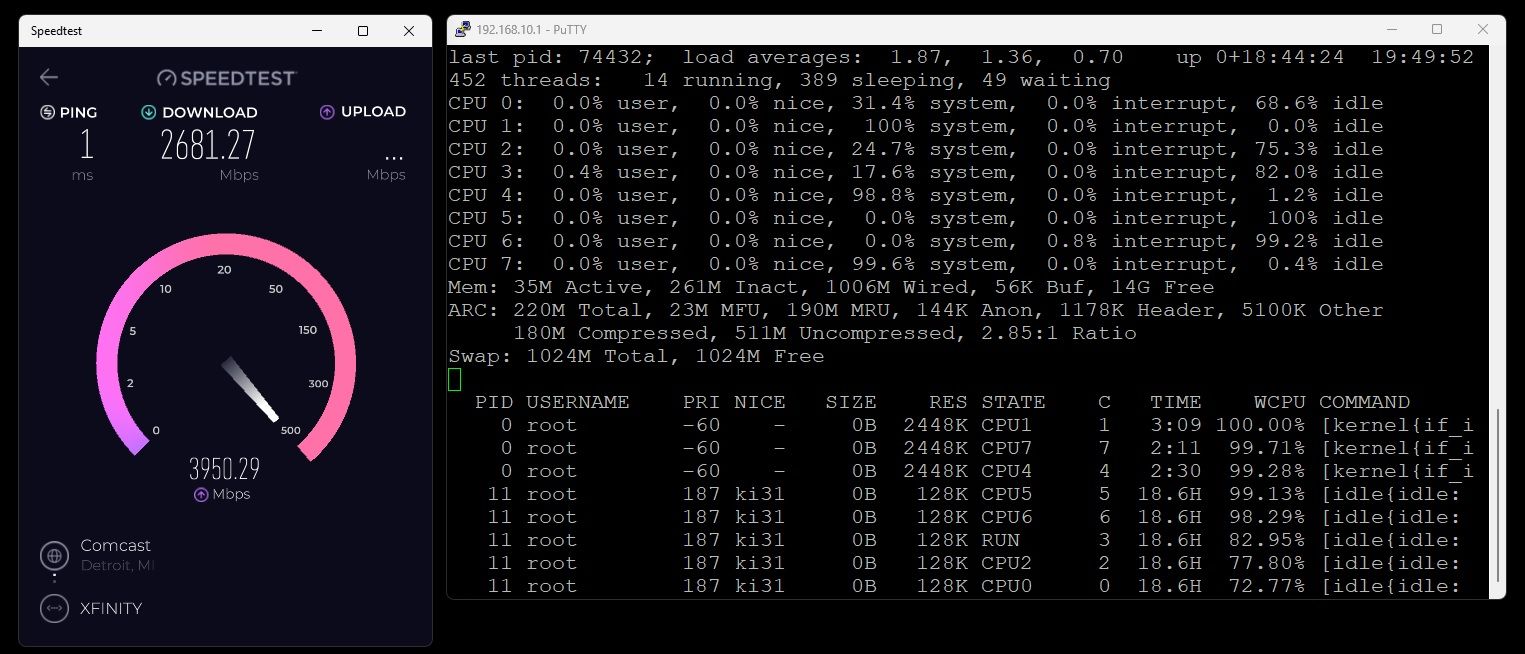
Here are screenshots in each direction (mind you the ones showing the 'top' results are two separate speed tests because of the mechanics of taking the screenshot.
And here are three subsequent speed tests right afterwards. These are from a 10G-connected PC that can achieve near line rate speeds with anything on the LAN and also through the previous DIY PC firewall (with rules enabled).
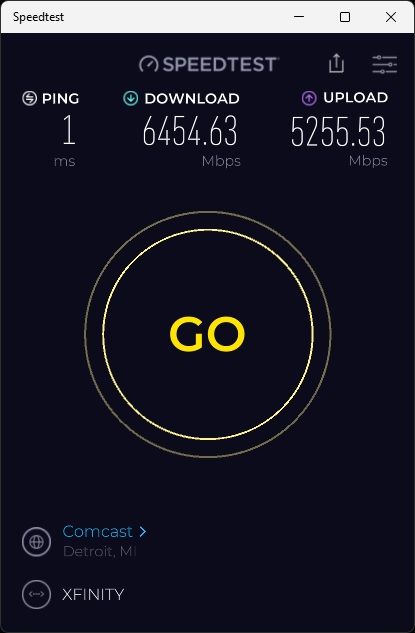
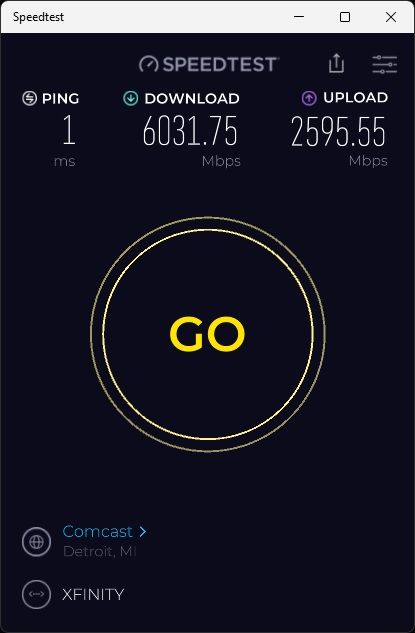
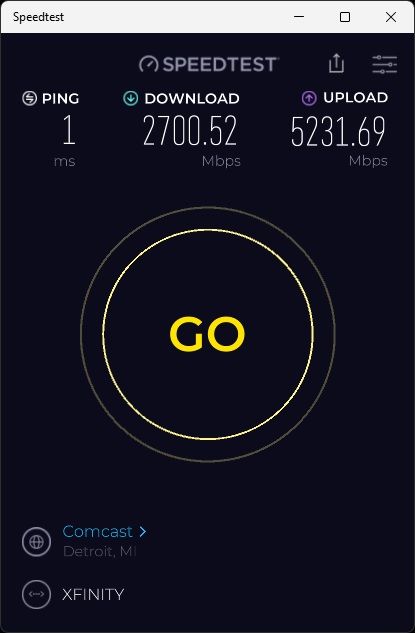
-
Hmm, speedtest usually uses multiple connections which allows the NICs in pfSense to use multiple queues and hence multiple CPUs cores.
Here we can see it's using at least 4 cores in the top screenshot and one of them is pegged at 100%. I assume you are using ix0 and ix1 as WAN and LAN here?
That is probably 2 Rx queues on WAN and 2 Tx queues on LAN then during the download test.
Those NICs support 8 Tx and 8 Rx queues each though so given sufficient connections they should be able to use all the CPU cores.
That interrupt value is normal. It's the interrupt rate which really matters and 300/s is low.
Have you set any config on that box or is it mostly default? Enabled/disabled any hardware off-loading?
-
@stephenw10 There's a lot of "config" in general, but nothing that should be too taxing... i.e. no IPSEC/VPN/Tunneling/pfBlocker/et al. I do have multi-WAN and an HE.net Tunnelbroker for backup IPv6 connectivity, and I'm using dot1q on my LAN interface with a handful of VLANs... Only added packages are pimd, iperf, and Patches.
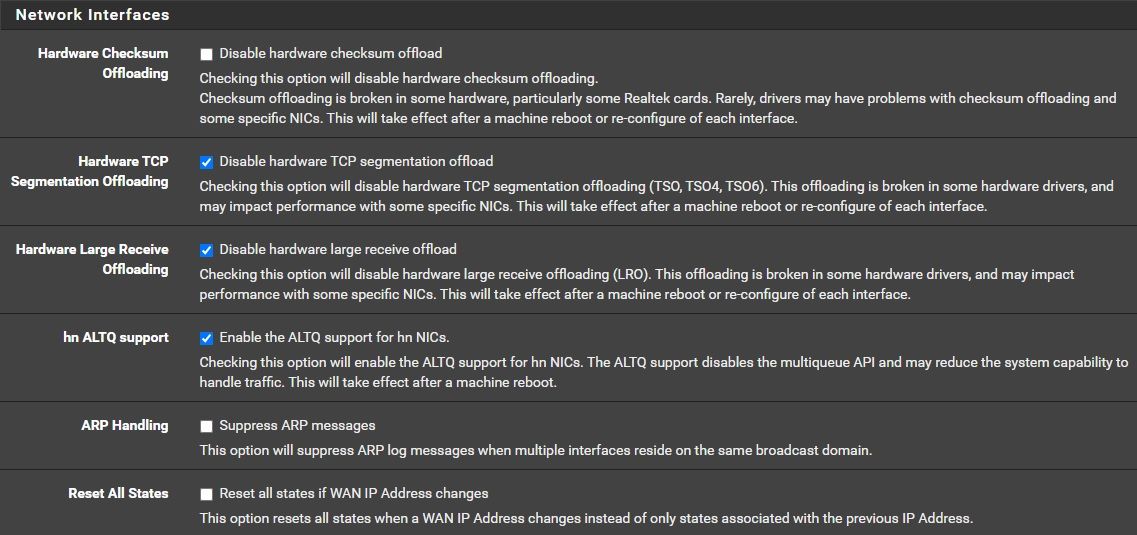
Correct, ix0 and ix1 for my primary WAN and my LAN (carrying all the VLANs). These are my current hardware offload settings, I did not change them... however the ALTQ setting looks new to me (don't recall seeing it as an option on my DIY build), would disabling that be worthwhile? I am not using any advanced queueing/CoDEL etc.
also, side-note: i performed a power-cycle on the unit yesterday evening (it had no effect on the performance)
-
That ALTQ setting only does anything to hn NICs (hyper-v or Azure). You can disable it.
You might try enabling (by unchecking) the off loading for LRO and TSO. In some situations that can help quite a bit.
-
@stephenw10 No luck :( Unchecked all three boxes, Halted & pwr-cycled the 8200... booted it back up and I basically get the same results (consistently inconsistent results ranging from 3Gb/s-6Gb/s up and/or down, w/2-3 cores maxing out at 100%). I also tried to disable firewalling completely, and my testing was still around 3.5-3.6Gb/s w/iperf running on the firewall (same as before, but as you said -- not that great of a test).
Unfortunately I didn't really have an easy way to "test through" the 8200 w/NAT disabled, though... the Speedtest app from the Windows Store as well as the speedtest.net website seem IPv4-dependant. I'll see if I can get a pure IPv6 speedtest from somewhere.
Any other ideas? Any intel NIC chipset tunables I should maybe try tweaking? I would be happy if I could consistently/reliably achieve half of what the advertised specs are at this point.
-
Check the boot logs. Make sure you are seeing 8 queues per NIC.
Check the output of:
vmstat -i -
Hi @inferno480 -
Here's some more information on network tuning:
- https://calomel.org/freebsd_network_tuning.html
- https://docs.netgate.com/pfsense/en/latest/hardware/tune.html
- https://man.freebsd.org/cgi/man.cgi?query=iflib&apropos=0&sektion=4&manpath=FreeBSD+14.0-STABLE&arch=default&format=html
I agree with @stephenw10 that the first thing to check is to make sure that you have the right amount of RX and TX queues configured for your 8 core system. If that is the case, there are other settings you could try to tune as well: The first link above is more comprehensive FreeBSD network tuning guide, the second link has hardware tuning recommendations from the Netgate documentation (check out the
Intel ix(4) Cardssection). The third link is the manual entry foriflibwhich is a driver framework FreeSBD uses for network interface drivers. You can tune settings there by adding entries into your loader.conf.local file. The general syntax isdev.<interface name>.<interface number>.iflib.<tunable>=<value>. For example,dev.ix.0.iflib.override_nrxqs="8". Increasing the number of RX and TX descriptors might help, as well as increasing the rx_budget. I have not tried changing theseparate_txrxparameter, but it might help give a better packet flow distribution across the cores.Hope this helps.
-
@tman222 Thanks for the tips, unfortunately still having the same issue of consistently inconsistent speeds that aren't even half of what's advertised. :(
Prior to making any of these changes, my speed tests (in Mbits/s) were:
6485 down, 3689 up
5808 down, 5027 up
3098 down, 5017 up
3969 down, 4638 upI made the two recommended ix driver tweaks from the Netgate docs, and also the iflib changes. I did not touch any generic FreeBSD network tuning (yet) and had a question on the RX/TX Descriptors settings, but here is my /boot/loader.conf.local:
kern.ipc.nmbclusters="1000000"
kern.ipc.nmbjumbop="524288"
dev.ix.0.iflib.override_nrxqs="8"
dev.ix.0.iflib.override_ntxqs="8"
dev.ix.1.iflib.override_nrxqs="8"
dev.ix.1.iflib.override_ntxqs="8"
dev.ix.0.iflib.separate_txrx="1"
dev.ix.1.iflib.separate_txrx="1"
dev.ix.0.iflib.rx_budget="64"
dev.ix.1.iflib.rx_budget="64"Wasn't quite sure what to adjust the RX/TX Descriptors to since I do not know the current values or what this particular chipset wants for syntax...
override_nrxds
Override the number of RX descriptors for each queue. The value
is a comma separated list of positive integers. Some drivers
only use a single value, but others may use more. These numbers
must be powers of two, and zero means to use the default.
Individual drivers may have additional restrictions on allowable
values. Defaults to all zeros.override_ntxds
Override the number of TX descriptors for each queue. The value
is a comma separated list of positive integers. Some drivers
only use a single value, but others may use more. These numbers
must be powers of two, and zero means to use the default.
Individual drivers may have additional restrictions on allowable
values. Defaults to all zeros.My speeds after the changes were:
5146 down, 3857 up
3167 down, 3989 up
5624 down, 4996 up
6786 down, 3843 upI'm pretty sure it's using 8 queues, although I don't see any "TX Queues" in vmstat, hopefully that's normal:
from Status -> System Logs -> OS Boot:
(...)
ix0: <Intel(R) X553 N (SFP+)> mem 0x80400000-0x805fffff,0x80604000-0x80607fff at device 0.0 on pci9
ix0: Using 2048 TX descriptors and 2048 RX descriptors
ix0: Using 8 RX queues 8 TX queues
ix0: Using MSI-X interrupts with 9 vectors
ix0: allocated for 8 queues
ix0: allocated for 8 rx queues
ix0: Ethernet address: 90:ec:77:6c:af:7f
ix0: eTrack 0x8000084b PHY FW V65535
ix0: netmap queues/slots: TX 8/2048, RX 8/2048
ix1: <Intel(R) X553 N (SFP+)> mem 0x80200000-0x803fffff,0x80600000-0x80603fff at device 0.1 on pci9
ix1: Using 2048 TX descriptors and 2048 RX descriptors
ix1: Using 8 RX queues 8 TX queues
ix1: Using MSI-X interrupts with 9 vectors
ix1: allocated for 8 queues
ix1: allocated for 8 rx queues
ix1: Ethernet address: 90:ec:77:6c:af:80
ix1: eTrack 0x8000084b PHY FW V65535
ix1: netmap queues/slots: TX 8/2048, RX 8/2048
(...)from 'vmstat -i':
[23.05.1-RELEASE][admin@pfSense.hadesgate.lan]/root: vmstat -i
interrupt total rate
irq16: sdhci_pci0+ 866 0
cpu0:timer 4280150 26
cpu1:timer 2495245 15
cpu2:timer 2470775 15
cpu3:timer 2570165 15
cpu4:timer 2623994 16
cpu5:timer 2690508 16
cpu6:timer 2600422 16
cpu7:timer 2582874 15
irq128: nvme0:admin 23 0
irq129: nvme0:io0 357532 2
irq130: nvme0:io1 361656 2
irq131: nvme0:io2 370062 2
irq132: nvme0:io3 366580 2
irq133: nvme0:io4 362204 2
irq134: nvme0:io5 367842 2
irq135: nvme0:io6 369601 2
irq136: nvme0:io7 367741 2
irq157: xhci0 1 0
irq158: ix0:rxq0 3153201 19
irq159: ix0:rxq1 3559443 21
irq160: ix0:rxq2 4185103 25
irq161: ix0:rxq3 4781562 29
irq162: ix0:rxq4 6998194 42
irq163: ix0:rxq5 5870912 35
irq164: ix0:rxq6 3420340 20
irq165: ix0:rxq7 4918691 29
irq166: ix0:aq 3 0
irq167: ix1:rxq0 5051730 30
irq168: ix1:rxq1 4969508 30
irq169: ix1:rxq2 5570319 33
irq170: ix1:rxq3 5975594 36
irq171: ix1:rxq4 7754642 46
irq172: ix1:rxq5 6481380 39
irq173: ix1:rxq6 5166430 31
irq174: ix1:rxq7 6701846 40
irq175: ix1:aq 6 0
irq176: ix2:rxq0 328394 2
irq177: ix2:rxq1 333122 2
irq178: ix2:rxq2 3866 0
irq179: ix2:rxq3 323267 2
irq180: ix2:rxq4 4147 0
irq181: ix2:rxq5 4011 0
irq182: ix2:rxq6 3790 0
irq183: ix2:rxq7 3769 0
irq184: ix2:aq 2 0
irq185: ix3:rxq0 325946 2
irq186: ix3:rxq1 3263 0
irq187: ix3:rxq2 53158 0
irq188: ix3:rxq3 322222 2
irq189: ix3:rxq4 2823 0
irq190: ix3:rxq5 2762 0
irq191: ix3:rxq6 324990 2
irq192: ix3:rxq7 3089 0
irq193: ix3:aq 2 0
Total 111839768 670Should I be concerned about these nag messages in my OS Boot system logs?
iwi_bss: You need to read the LICENSE file in /usr/share/doc/legal/intel_iwi.LICENSE.
iwi_bss: If you agree with the license, set legal.intel_iwi.license_ack=1 in /boot/loader.conf.
module_register_init: MOD_LOAD (iwi_bss_fw, 0xffffffff8076b090, 0) error 1
iwi_ibss: You need to read the LICENSE file in /usr/share/doc/legal/intel_iwi.LICENSE.
iwi_ibss: If you agree with the license, set legal.intel_iwi.license_ack=1 in /boot/loader.conf.
module_register_init: MOD_LOAD (iwi_ibss_fw, 0xffffffff8076b140, 0) error 1
iwi_monitor: You need to read the LICENSE file in /usr/share/doc/legal/intel_iwi.LICENSE.
iwi_monitor: If you agree with the license, set legal.intel_iwi.license_ack=1 in /boot/loader.conf.
module_register_init: MOD_LOAD (iwi_monitor_fw, 0xffffffff8076b1f0, 0) error 1 -
@inferno480 I should mention... core utilization behavior seems unchanged. Still just 2-3 cores maxing out during a speed test in either direction, with or without all the settings changes/tunings, with or without the NIC hardware offloading disabled.
-
@inferno480 - thanks for getting back to us.
Here are a few more things you could try:
- The
rx_budgetbudget value can be set a lot higher. I currently have mine set to the maximum, which is65535. - The RX and TX descriptors can be increased all the way to up to
4096I believe, and that may also be worth trying. The current values are 2048 for both RX/TX (you can see this in the boot logs you posted). - Have you tried a different speed test? For instance I know that with Netflix's speed test (Fast.com) you can tune the number of parallel connections in the Settings. Does increasing the number of parallel connections result in your connection bandwidth and CPU cores being more fully utilized?
- Another tunable you may want to adjust is the
hw.intr_storm_thresholdvalue. Were you able to change that one? The value I would use there is10000as per the Netgate documentation: https://docs.netgate.com/pfsense/en/latest/hardware/tune.html#intel-ix-4-cards
Hope this helps.
- The
-
@inferno480 - one thing I forgot to ask, what CPU was in your DIY build you used before?
-
@tman222 So the latest suggestions did help... somewhat. Noticed the improvements after increasing descriptors to 4096. I did already have the interrupt threshold increased, but forgot to mention it as it was a System Tunable and not part of loader.conf.local.
5693.41 down, 3765.58 up
9197.79 down, 3792.50 up
8937.57 down, 3149.12 up
5580.54 down, 3987.94 upI am now seeing download speed tests that are often in the more-acceptable range, but not very consistently. Now, 3-4 cores max-out instead of just 2-3. However, upload speeds are certainly still an issue and might possibly seem worse.
I have tried other speed test sites, but I can typically only get near-line rate (9Gb/s+) to my ISP's (Comcast). When using Fast.com, I get around 5.0Gb/s download and 1.5 Gb/s upload, even if I set it to a min & max of 8 streams (I've also tried 16). The weird thing with Fast.com is that initially speeds seem good (7-8Gb/s but then they "level off" to 5.0Gb/s over the duration of the test. From what I recall, these were about the speeds I would typically see to Fast.com on my old router... but the night & day difference is with my ISP's SpeedTest.net server using the Ookla SpeedTest.net app from the Windows Store.
So about that old server... massive overkill for a router. It was an ASUS P12R-E-10G-2T Motherboard with a Xeon E-2388G CPU with an old Intel X520-SR2 (dual SFP+ 10GbE NIC), 16GB RAM, running my primary 10G WAN and LAN ports.
This is my current loader.conf.local... I confirmed all the changes seem to be showing up in the OS Boot log.
legal.intel_iwi.license_ack="1"
kern.ipc.nmbclusters="1000000"
kern.ipc.nmbjumbop="524288"
dev.ix.0.iflib.override_nrxqs="8"
dev.ix.0.iflib.override_ntxqs="8"
dev.ix.1.iflib.override_nrxqs="8"
dev.ix.1.iflib.override_ntxqs="8"
dev.ix.0.iflib.separate_txrx="1"
dev.ix.1.iflib.separate_txrx="1"
dev.ix.0.iflib.rx_budget="65535"
dev.ix.1.iflib.rx_budget="65535"
dev.ix.0.iflib.override_nrxds="4096"
dev.ix.1.iflib.override_nrxds="4096"
dev.ix.0.iflib.override_ntxds="4096"
dev.ix.1.iflib.override_ntxds="4096" -
I appreciate all the support I received on here, but today I ended up returning my 8200. mostly it was me misunderstanding the advertised throughput values. I somehow either had the non-Firewalled or the TNSR values in my head which became my expectations. I was achieving 5Gb/s download speed pretty consistently, but needed a beefier box in order to exceed that so I'm going to be switching back to a DIY build (probably not as much overkill as I had before though).
-
 Z Zosh 0 referenced this topic on
-
S SwissSteph referenced this topic on
-
S SwissSteph referenced this topic on