Intermittent Drop on LAN
-
Yes 2.7.2 is current version but I doubt that's the issue.
Do you have other VMs sharing the same physical NIC? Do they lose packets?
What is actually logged in pfSense when this happens?
Are you seeing all connectivity lost? For how long?
What VMWare version are you running?
Steve
-
@stephenw10 Yeah sorry its version 2.7.2 that we have now on the live VM. Other VM's on the same NIC and ESXi host never experience lose packets. Weve got another interface on the same pfsense and I never see packet lose on that compared to the LAN interface.
263c7ce4-99ba-4836-89db-d7acedcb79c2-image.png] (/assets/uploads/files/1706125146411-263c7ce4-99ba-4836-89db-d7acedcb79c2-image.png)
It's only the LAN that drops. We have a default route from our core router that routes to the LAN interface of this pfsense.
We are on an HCI environment and hosts on VMware ESXi, 8.0.1
-
@Gertjan Its version 2.7.2. Sorry. It's a VM running on our HCI environment.
-
Further investigation I found out that the packet loss I see on Multiping correlates with my traffic graph on our Netflow Analyzer. Can see spikes on traffic graph to 1000Mbps or over that's when I see packet loss on multiping. Could this be a limitation on the E1000 NICs? For now, what we've done is run version 2.7.2 on a staging VM, add a new adapter with VMXNET3 and assign that to the LAN interface. Will see how it goes.
Any other recommendations on this matter will be really appreciated.
-
If you're filling the available bandwidth then, yes, that can cause packet loss.
Generally using vmxnet NICs in VMWare gives better performance. But note the tuning options here:
https://docs.netgate.com/pfsense/en/latest/hardware/tune.html#vmware-vmx-4-interfaces -
@stephenw10 Just saw another loss around 30 minutes ago on Multiping. Traffic graph was 800Mbps at that time of the packet loss on the LAN interface. We have two internet links connecting on the pfsense as well. WAN is 100Mbps up/down and another interface with another ISP as our primary link is 500Mbps up/down. On our netwflow analayzer, when I drill down to the traffic flow, I notices it's just normal HTTPS traffic destined to our zscaler tunnel via our primary link. So may be when the flow
-
The screenshot you uploaded failed to upload it looks like so I'm not sure exactly what you're referring to.
What do the CPU monitoring graphs look like when it starts to drop?
-
@stephenw10 Wasn't able to see that from the pfsense dashboard whenever we loss packets. But I'm using PRTG and LibreNMS and CPU (4) never shows to go above 50%, How about I configure traffic shaping on that LAN interface ? I notice too on my Netflow analyzer that the packet loss happens when the volume goes above 1Gb.
Any help there will be really appreciated
-
Without those tuning options vmxnet will only use one queue (one CPU core) so you might be hitting 100% on one core and see 50% total.
To know for sure you need to runtop-HaSPat the CLI whilst testing and seeing packet loss.Check Status > Monitoring to see what pfSense logs at that point.
Traffic shaping could help prevent hitting a CPU limit. But it would still drop packets for some protocols.
-
@stephenw10 Thanks for the reply. On my CPU graphs off LibreNMS and PRTG it all shows the 4 CPU as below when I see packet loss
cpu0 max 36%
cpu1 max 36%
cpu2 max 59%
cpu3 max 29%Had the same pattern today with the first packet loss at 9am. Status/Monitoring. The following Maximum value I can see.
user util 8.95%
nice util 0.17%
system util. 22.65%
interrupt 21.90%
processes 709.01Unfortunately, that top-HaSP command on the shell cli doesn't seem to be available. If you can, I would really appreciate if you can point me to a list of common CLI for troubleshooting purposes.
-
700 processes is a lot. Is there something spawning hundreds of things it shouldn't?
Sorry I typo'd:
top -HaSP -
@stephenw10 Hhmm. It's always around 700 even during non-peak hours when we don't see packet loss.
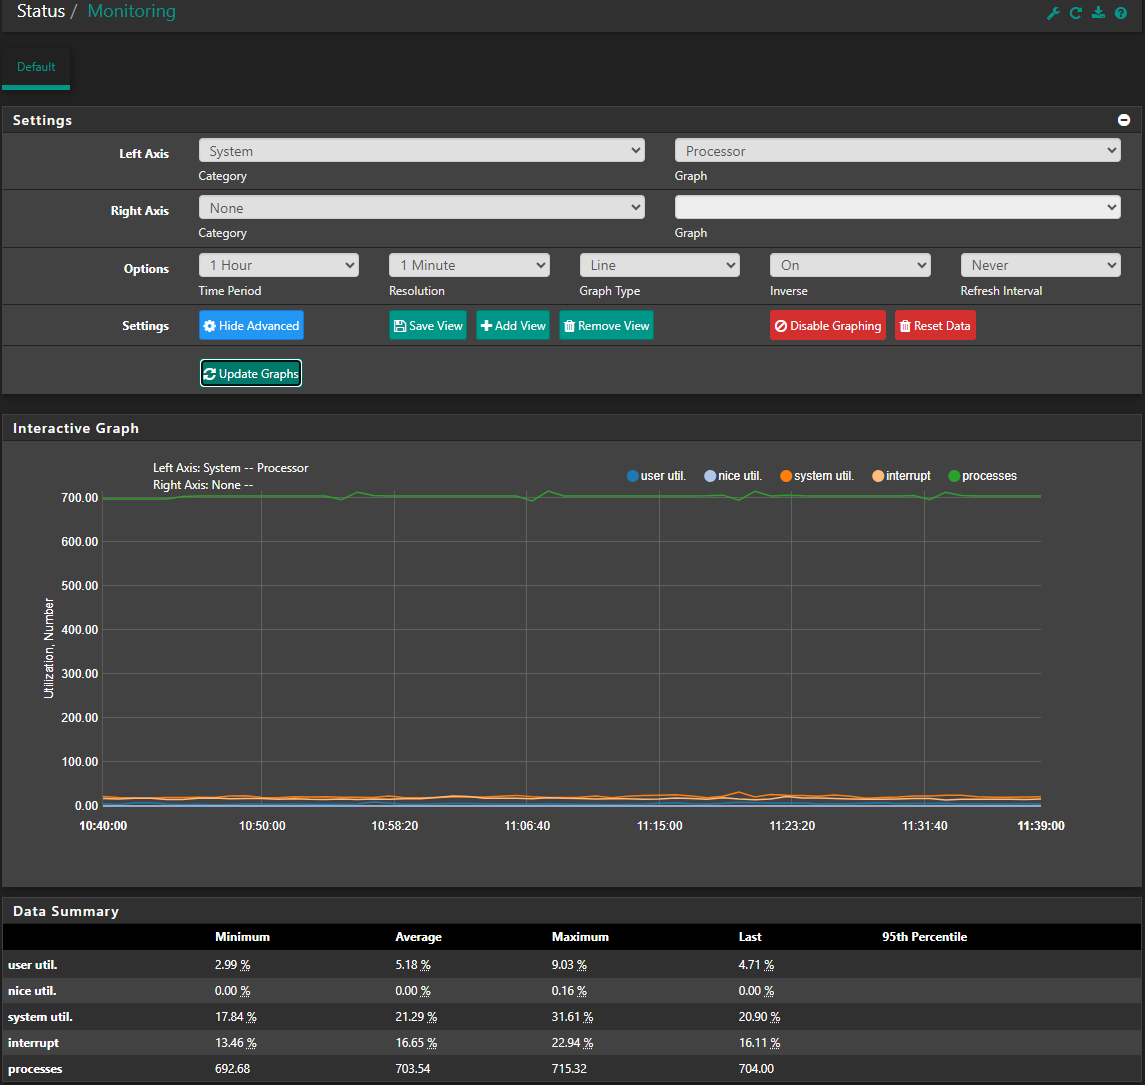
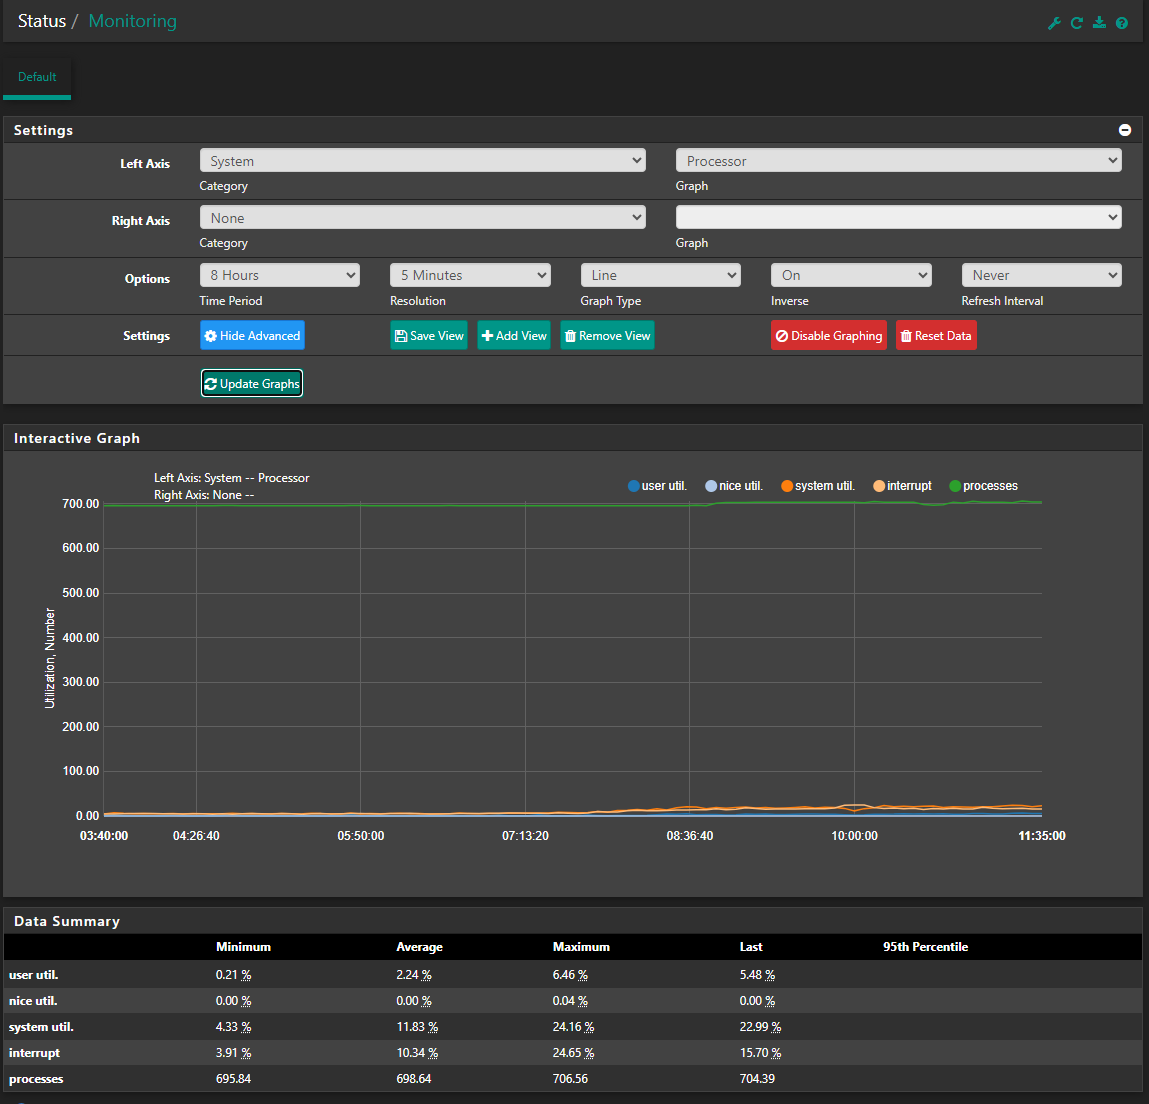
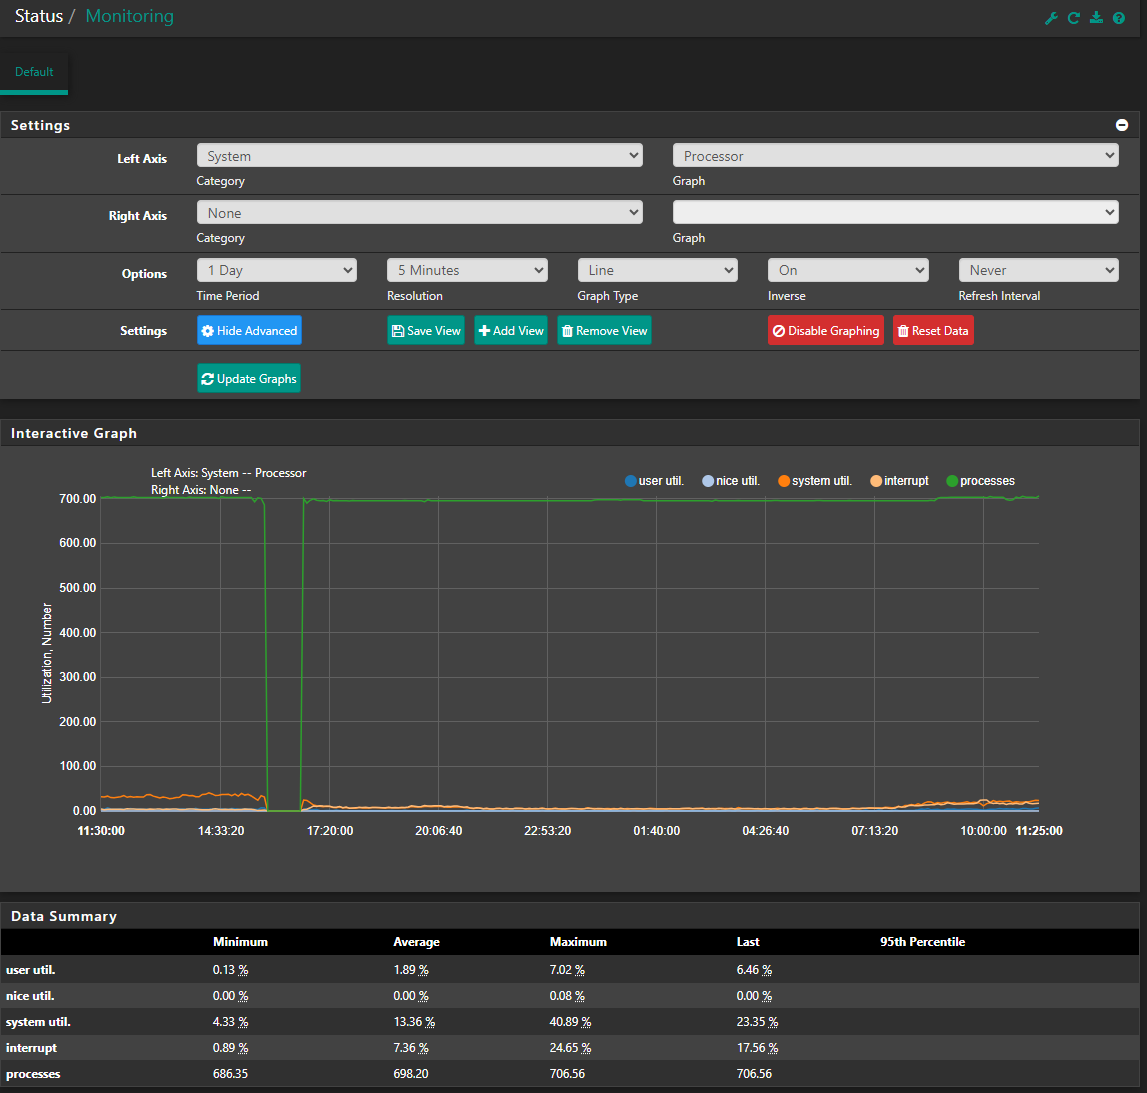
Not sure if you can see these graph. 1 day, 8 hours and 1 hour
-
Yup I see. It's a high number of processes so I'd certainly check it. It doesn't seem to be peaking though so probably not an issue.
Try running
top -HaSP -
@stephenw10 Further investigation we realize that our vswitch and the vmnetwork where the LAN interface is connected to is set to 9000 Bytes MTU. pfSense LAN MTU is set to autodetect. Status show its on 1500
Could this be the issue considering the number of processes? -
@stephenw10 Could this be the issue with MTU mismatch? Is it okay to force the LAN interface to 9000MTU? Packet fragmentation process at the LAN interface causing latency and packet loss?
-
Yes an MTU mismatch would cause it to drop anything that arrives with jumbo packets. The vswitch itself wouldn't do that but if any of the clients are set to MTU 9000 that's a problem. Generally you should have everything in the same layer 2 segments set to the same MTU. The MTU value is not autodetetcted or negotiated, it must be set.
-
@stephenw10 Thanks for the reply. Jumbo frames are on the vPC inter switch link between our core L3 switch and the L2 switch hosting our VMware ESXi hyperconvergence infrastructure and on the vPC interface connected to the ESXi host and the vswitch.
-
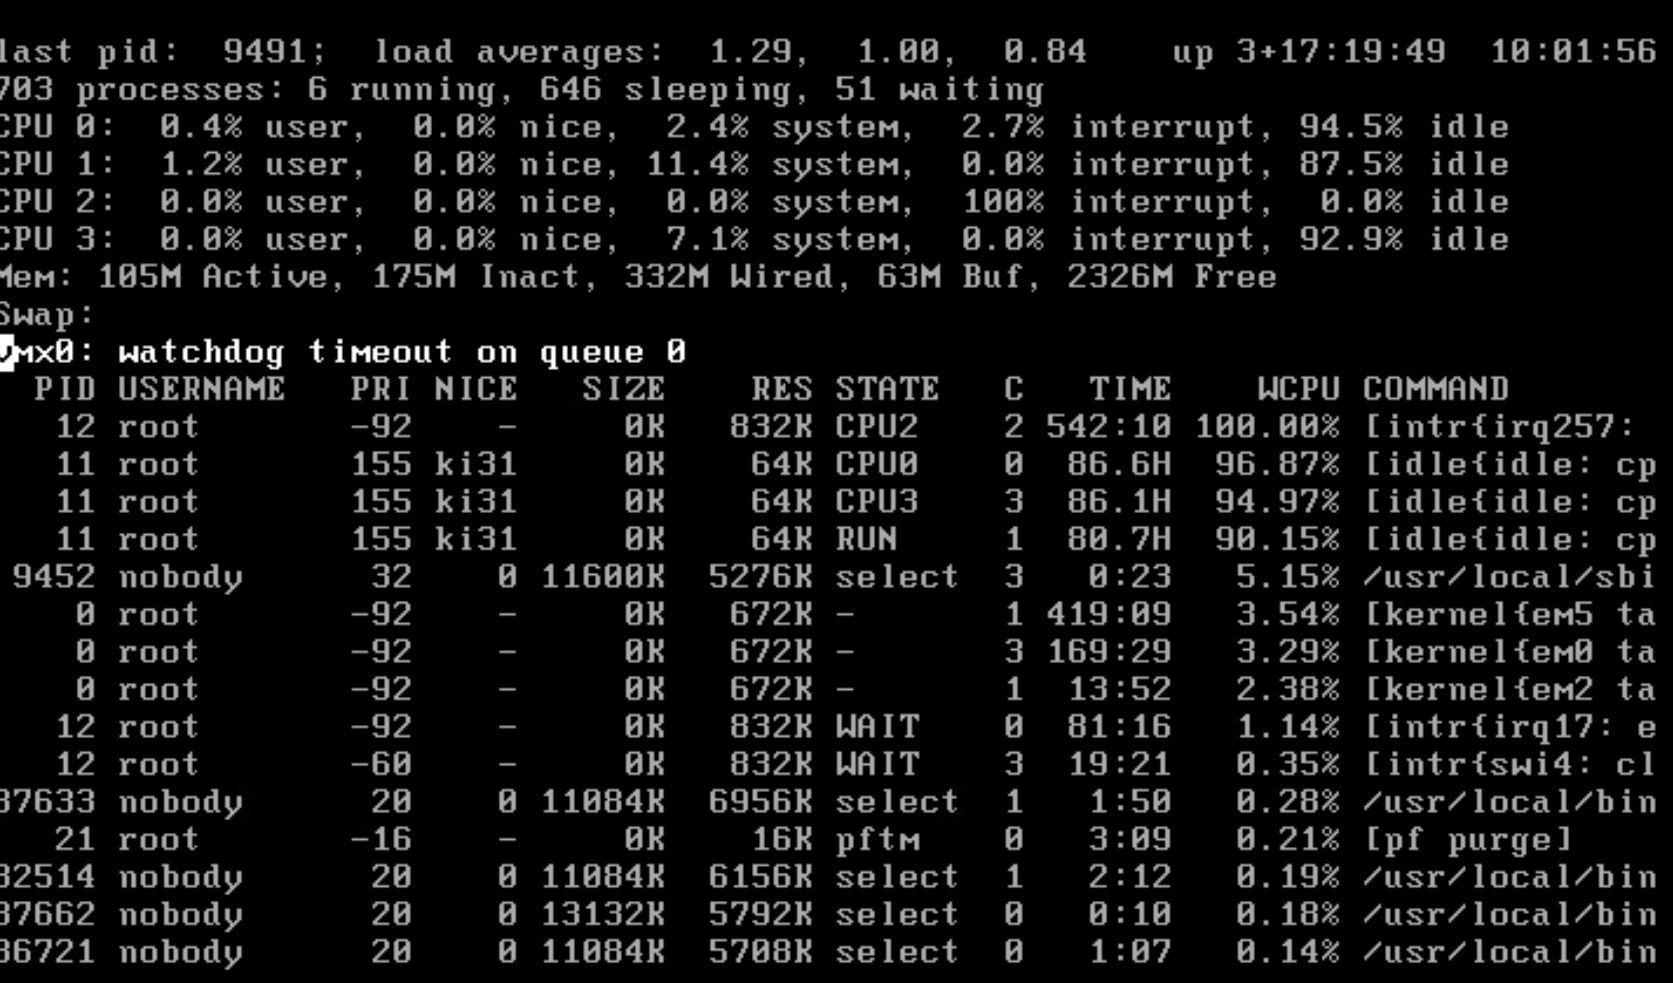
Manage to capture the top -HaSP result. Here it is.
-
If it's only on the switch that shouldn't be an issue. But if any other hosts or the layer3 switch are set to MTU 9000 that's an issue.
However that top output looks to show the issue. One core is pegged at 100% and it's all interrupt load from irq257 which I'd guess in vmx0.
Did you set the NIC tuning I linked to above? That is required to have vmx use more than one queue and hence more than one CPU core.Additionally you can see that vmx0 threw a watchdog timeout in that screenshot. I expect that to be logged?
-
@stephenw10 hi, this is @usaiat 's colleague.
I have created /boot/loader.conf.local and put this in it:
hw.pci.honor_msi_blacklist="0"
dev.vmx.0.iflib.override_ntxds="0,4096"
dev.vmx.0.iflib.override_nrxds="0,2048,0"
After the the reboot I did a
dmesg | grep -Eiw 'descriptors|queues'and I got the following output
em0: netmap queues/slots: TX 1/256, RX 1/256
em1: netmap queues/slots: TX 1/256, RX 1/256
em2: netmap queues/slots: TX 1/256, RX 1/256
em3: netmap queues/slots: TX 1/256, RX 1/256
em4: netmap queues/slots: TX 1/256, RX 1/256
em5: netmap queues/slots: TX 1/256, RX 1/256
em6: netmap queues/slots: TX 1/256, RX 1/256
em0: netmap queues/slots: TX 1/256, RX 1/256
em1: netmap queues/slots: TX 1/256, RX 1/256
em2: netmap queues/slots: TX 1/256, RX 1/256
em3: netmap queues/slots: TX 1/256, RX 1/256
em4: netmap queues/slots: TX 1/256, RX 1/256
em5: netmap queues/slots: TX 1/256, RX 1/256
em6: netmap queues/slots: TX 1/256, RX 1/256I note that vmx0 isn't listed there - did we do that right thing?