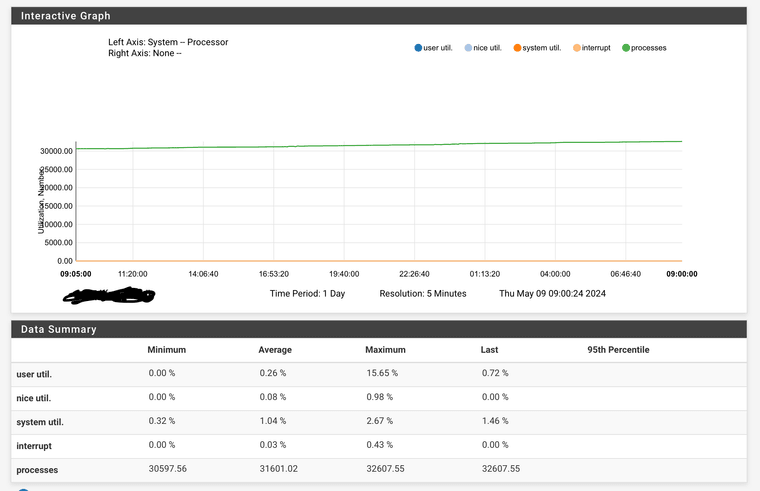
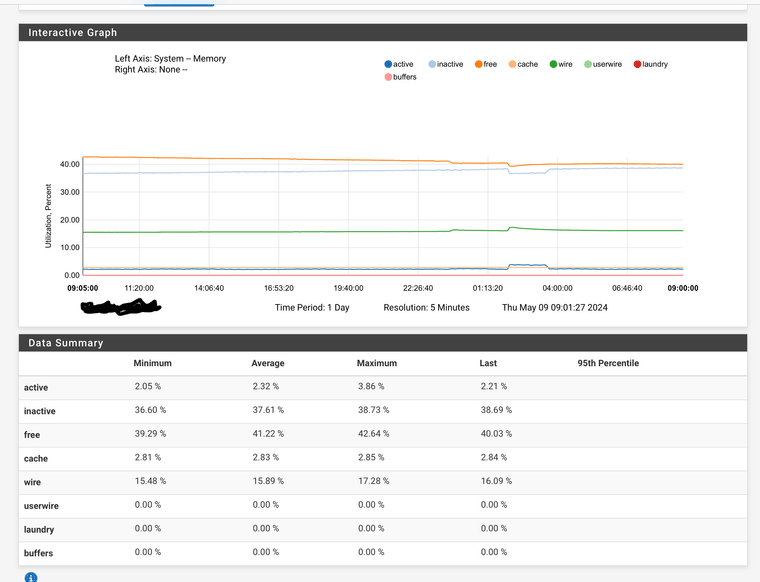
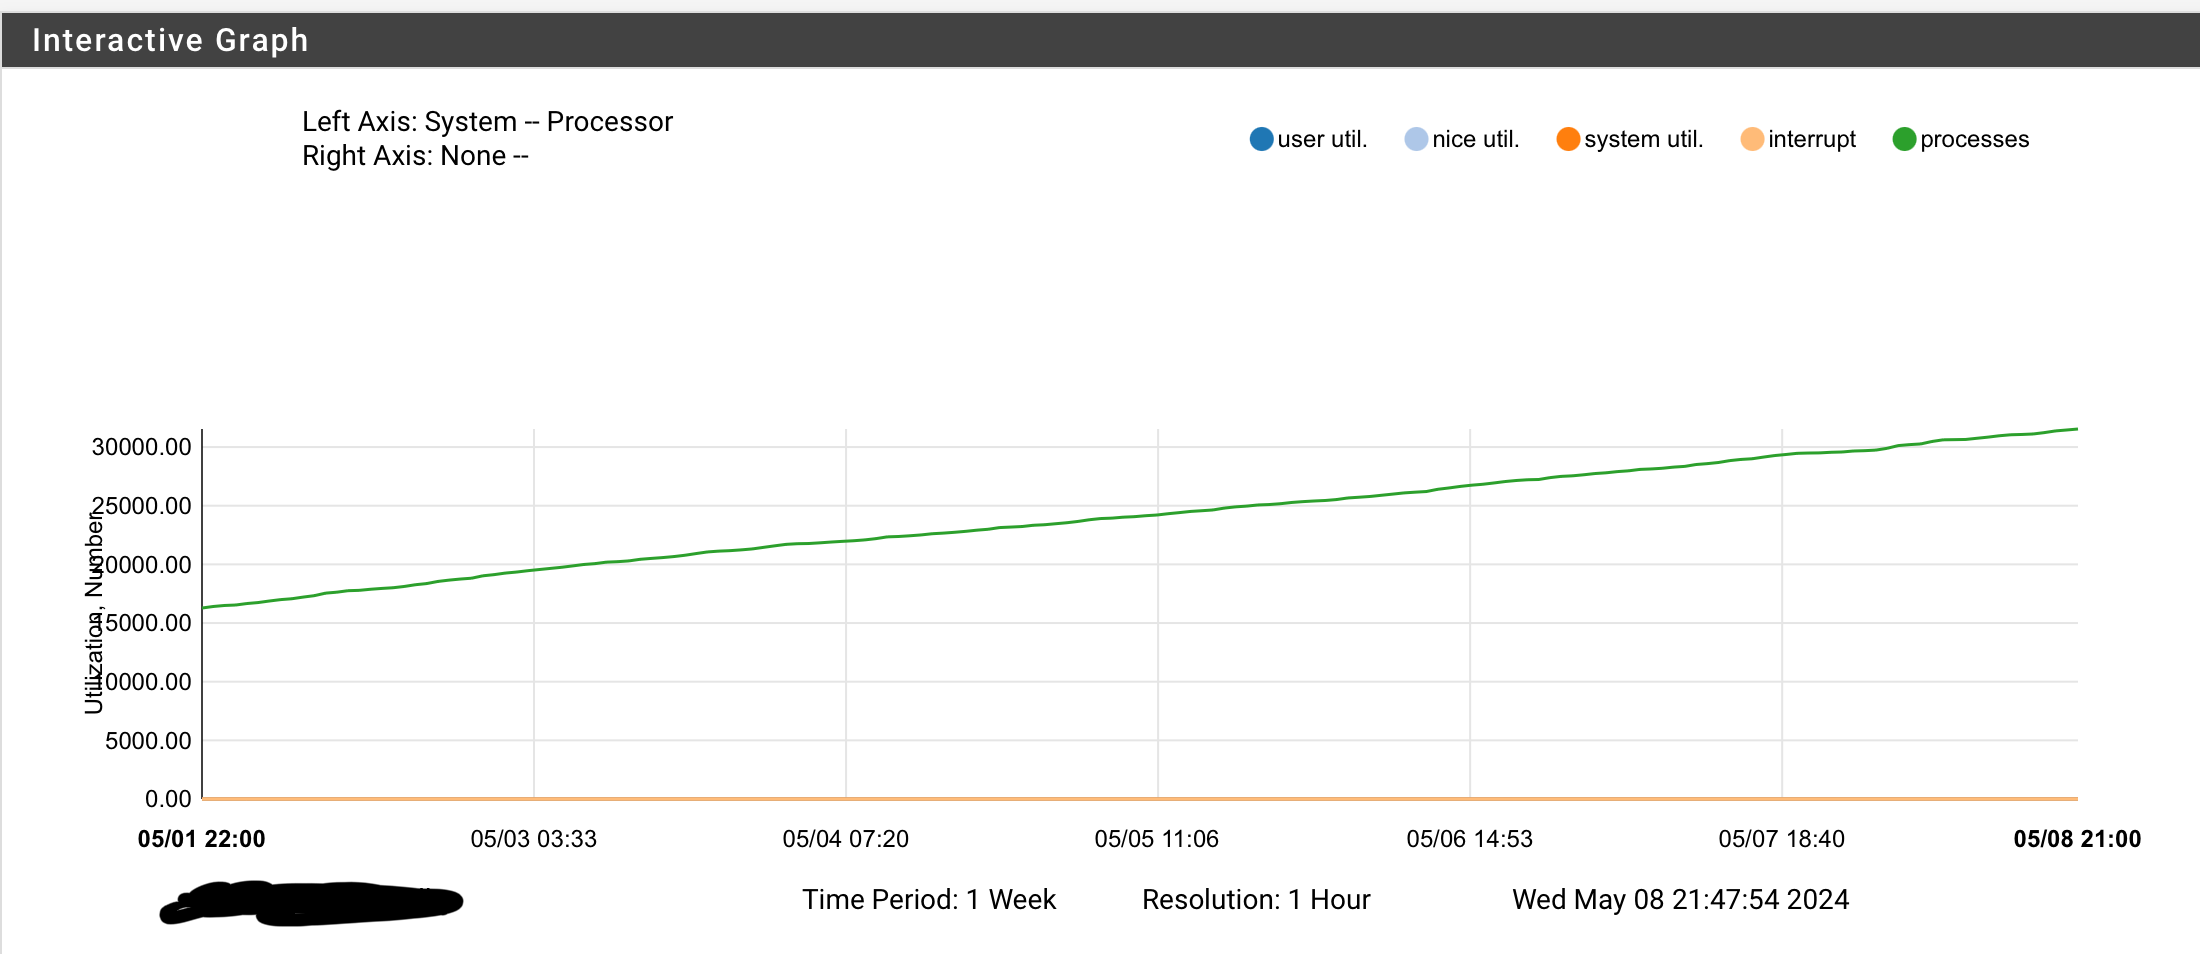
24.03 causes sustained rise in processes count and memory usage.
-
@dennypage I should mention the problem is exactly the same on my 2100 ARM based box. Thousands of identical lines like those posted here - only the RSS number and date is different (because this box was rebooted the other day - therefore has only reached about 5000 processes until now).
-
@dennypage said in 24.03 causes sustained rise in processes count and memory usage.:
@keyser said in 24.03 causes sustained rise in processes count and memory usage.:
I assume this is the culprit as 30.000 of those threads is not normal - and very consistent with the growing list of processes (just passed 30.000).
Hang on... do you mean that there are "thirty thousand" of those processes?!?
Yes - like the graph shows and so does my ps -Haxuww output.
-
@keyser Wow. Yes, I would say that's a problem.
I would disable netflow (as @stephenw10 suggested) and see if it stops.
-
@stephenw10 can’t really do that as those are my internet access rules

I would have a family revolte on my hands if I try that….But I could ask it not to dump flows on that rule and see if it stabilizes.
I will do that now, but it will take about a day before I can verify if that is the cause. -
@keyser I don't think you need to disable the rules, just turn off the netflow output.
-
Yup just disable pflow on them as a test.
Is that output truncated? Does it look like:
0 412221 kernel netlink_socket (PID mi_switch _sleep taskqueue_thread_loop fork_exit fork_trampoline -
@stephenw10 No, it doesn’t seem truncated - there are other normal lines wastly longer than the 30 odd thousant lines that I posted a few of.
The post is a copy of the full lines shown from the ps output.So no, it does not look like the one you posted.
-
Hmm. What do you from
procstat -k <pid>using the ID of one of those? -
@stephenw10 said in 24.03 causes sustained rise in processes count and memory usage.:
Hmm. What do you from
procstat -k <pid>using the ID of one of those?Since the PID is “0” in all the 30.000 lines, and only the text “PID” is mentioned at the end of each line, I don’t know which PID to actually use with your command.
-
Ah, I see. Hmm....
-
@stephenw10 @dennypage It seems its not related to the new netflow export feature. On one box I disabled the export on the two rules I’m monitoring (internet access), and on the other box I disabled netflow export globally in the menu (diabled the feature).
On both boxes another ~ 500 processes was left stranded during the night and inactive memory went up a little more.
Here’s the dump monitor info from the 6100 I showed in the beginning:

I disabled pfflow about 10 hours ago, and as the monitoring shows it’s still growing. The memory bump at 2:00am is pfblocker releading lists.
-
@stephenw10 @dennypage I afterwards did some faultfinding logic by restarting services one at the time to see any impact on processes/memory, and I have found the culprit.
The problem is related to the BSNMPD service (the built in SNMPD) that I’m using to monitor my pfSenses from Zabbix.
When I restart that service all the thousands of stranded processes and their memory usage is freed, and the boxes are back to their expected levels.
Obviously it starts climbing again, so what can I do to help you guys figure the root cause so it can be fixed?Any help on “debugging” whats causing BSNMPD to leave the processes(memory) stranded would be good - it would help me create a more specific redmine ticket on the issue.
I’m using a community pfSense Template in Zabbix and using SMNPv2 which is all the buildin smnpd supports.
-
@keyser That's very interesting. That might point in the direction of a netlink file descriptor leak in bsnmpd.
We can probably confirm that with
procstat fd <bsnmp pid>.Is there anything non-default about your snmpd configuration? I monitor my 2100 with librenms and don't see the leak.
-
@kprovost I restarted the BSNMPD service about half an hour ago, so there’s only about 50 stranded processes right now.
Your command suggestion seems to indicate you are on the right track as there seems to be a similar amount of leftover references. Here’s the output:/root: procstat fd 89184
PID COMM FD T V FLAGS REF OFFSET PRO NAME
89184 bsnmpd text v r r------- - - - /usr/sbin/bsnmpd
89184 bsnmpd cwd v d r------- - - - /
89184 bsnmpd root v d r------- - - - /
89184 bsnmpd 0 v c rw------ 3 0 - /dev/null
89184 bsnmpd 1 v c rw------ 3 0 - /dev/null
89184 bsnmpd 2 v c rw------ 3 0 - /dev/null
89184 bsnmpd 3 s - rw------ 1 0 ?
89184 bsnmpd 4 s - rw------ 1 0 UDP *:0 *:0
89184 bsnmpd 5 s - rw------ 1 0 UDP 192.168.255.1:161 *:0
89184 bsnmpd 6 s - rw------ 1 0 UDS 0 0 /var/run/snmpd.sock
89184 bsnmpd 7 s - rw------ 1 0 UDD /var/run/log
89184 bsnmpd 8 v c r------- 1 0 - /dev/pf
89184 bsnmpd 9 s - rw------ 1 0 ?
89184 bsnmpd 10 s - rw------ 1 0 ?
89184 bsnmpd 11 s - rw------ 1 0 ?
89184 bsnmpd 12 s - rw------ 1 0 ?
89184 bsnmpd 13 s - rw------ 1 0 ?
89184 bsnmpd 14 s - rw------ 1 0 ?
89184 bsnmpd 15 s - rw------ 1 0 ?
89184 bsnmpd 16 s - rw------ 1 0 ?
89184 bsnmpd 17 s - rw------ 1 0 ?
89184 bsnmpd 18 v c r------- 1 0 - /dev/null
89184 bsnmpd 19 v c r------- 1 0 - /dev/null
89184 bsnmpd 20 s - rw------ 1 0 UDS 0 0 /var/run/devd.pipe
89184 bsnmpd 21 v c rw------ 1 0 - /dev/mdctl
89184 bsnmpd 22 v c r------- 1 0 - /dev/null
89184 bsnmpd 23 v c r------- 1 0 - /dev/null
89184 bsnmpd 24 s - rw------ 1 0 ?
89184 bsnmpd 25 s - rw------ 1 0 ?
89184 bsnmpd 26 s - rw------ 1 0 ?
89184 bsnmpd 27 s - rw------ 1 0 ?
89184 bsnmpd 28 s - rw------ 1 0 ?
89184 bsnmpd 29 s - rw------ 1 0 ?
89184 bsnmpd 30 s - rw------ 1 0 ?
89184 bsnmpd 31 s - rw------ 1 0 ?
89184 bsnmpd 32 s - rw------ 1 0 ?
89184 bsnmpd 33 s - rw------ 1 0 ?
89184 bsnmpd 34 s - rw------ 1 0 ?
89184 bsnmpd 35 s - rw------ 1 0 ?
89184 bsnmpd 36 s - rw------ 1 0 ?
89184 bsnmpd 37 s - rw------ 1 0 ?
89184 bsnmpd 38 s - rw------ 1 0 ?
89184 bsnmpd 39 s - rw------ 1 0 ?
89184 bsnmpd 40 s - rw------ 1 0 ?
89184 bsnmpd 41 s - rw------ 1 0 ?
89184 bsnmpd 42 s - rw------ 1 0 ?
89184 bsnmpd 43 s - rw------ 1 0 ?
89184 bsnmpd 44 s - rw------ 1 0 ?
89184 bsnmpd 45 s - rw------ 1 0 ?
89184 bsnmpd 46 s - rw------ 1 0 ?
89184 bsnmpd 47 s - rw------ 1 0 ?
89184 bsnmpd 48 s - rw------ 1 0 ?
89184 bsnmpd 49 s - rw------ 1 0 ?
89184 bsnmpd 50 s - rw------ 1 0 ?
89184 bsnmpd 51 s - rw------ 1 0 ?
89184 bsnmpd 52 s - rw------ 1 0 ?
89184 bsnmpd 53 s - rw------ 1 0 ?
89184 bsnmpd 54 s - rw------ 1 0 ?
89184 bsnmpd 55 s - rw------ 1 0 ?
89184 bsnmpd 56 s - rw------ 1 0 ?
89184 bsnmpd 57 s - rw------ 1 0 ?
89184 bsnmpd 58 s - rw------ 1 0 ?
89184 bsnmpd 59 s - rw------ 1 0 ?
89184 bsnmpd 60 s - rw------ 1 0 ?
89184 bsnmpd 61 s - rw------ 1 0 ?
89184 bsnmpd 62 s - rw------ 1 0 ?
89184 bsnmpd 63 s - rw------ 1 0 ?
89184 bsnmpd 64 s - rw------ 1 0 ?
89184 bsnmpd 65 s - rw------ 1 0 ?
89184 bsnmpd 66 s - rw------ 1 0 ?
89184 bsnmpd 67 s - rw------ 1 0 ?
89184 bsnmpd 68 s - rw------ 1 0 ?
89184 bsnmpd 69 s - rw------ 1 0 ?
89184 bsnmpd 70 s - rw------ 1 0 ?
89184 bsnmpd 71 s - rw------ 1 0 ?
89184 bsnmpd 72 s - rw------ 1 0 ? -
@kprovost Since there is VERY little you can configure in the builtin SNMP deamon apart from enabling it, I would think my only “non-default” settings is a custom community string (not “public”). Other than that it is enabled, running on IPv4 and my LAN interface.
Could it be a request that my zabbix template tries which no longer is interpreted/handled correctly by the daemon?
Looking at my latest data I seem to get valid returned data on all points, but I’m not zabbix neerdy enough to tell if discovery has something “leftover” that is not seen in the UI as a datapoint yet, and attempting to ask for data. -
@keyser Yeah, that confirms there's a leak there.
I think I can see where the bug is too. (Short version, there's a bug in libpfctl's pfctl_get_rules_info(), which opens a netlink socket and doesn't close it again. bsnmpd calls that function, and I'd expect it to be called at least once every time it gets polled. You'd get valid data, and wouldn't see anything wrong, other than the extra 'processes'.)
The only thing I don't quite understand is why I can't reproduce it on my 2100. It should be happening there too.The only bad news is that it's probably not going to be fixed until the next release. In the mean time you should be able to work around it by restarting the bsnmp service regularly.
It'll probably self-manage to some extent, in that sooner or later the bsnmp process will run into the file descriptor limit and just start failing, but that's not ideal either. -
@kprovost Okay - you seem to have your fingers deep into the subject matter on this one :-)
Will you create the needed redmine as you can probably describe the issue in much more detail than me?Any chance a patch might fix it, or something I can edit myself?
Not a huge problem as my calculations seems to suggest I can go at least a month without issues before I need to restart the BSNMPD service. I’ll manage if needed, but it would be nice to have a “non manual” workaround that does not include setting up a cron job or similar.Thanks for pitching in

-
@kprovost said in 24.03 causes sustained rise in processes count and memory usage.:
The only thing I don't quite understand is why I can't reproduce it on my 2100. It should be happening there too.
That seems to suggest it might also be related to what data my Zabbix is requesting or?
I collect quite a few data points as the template for zabbix is fairly comprehensive (in as so much as you can be comprehensive with only SNMP compared to a Zabbix Agent)
-
@keyser I've created https://redmine.pfsense.org/issues/15481 to track this.
It may be related to the data you request, although I'd expect snmpwalk to trigger it as well, and I've not managed to reproduce it that way.
Sadly there won't be a patch, because the problem is in a system library, not in a port or in php, which are easier to update.
-
Nice!

