Netgate Discussion Forum
    • Categories
    • Recent
    • Tags
    • Popular
    • Users
    • Search
    • Register
    • Login

    Tracing cause of cpu spike - SG1100

    Scheduled Pinned Locked Moved General pfSense Questions
    17 Posts 3 Posters 593 Views
    Loading More Posts
    • Oldest to Newest
    • Newest to Oldest
    • Most Votes
    Reply
    • Reply as topic
    Log in to reply
    This topic has been deleted. Only users with topic management privileges can see it.
    • M
      michmoor LAYER 8 Rebel Alliance
      last edited by

      Hello everyone
      I am trying to trackdown the cause of increased CPU utilization on a newly deployed SG-1100.
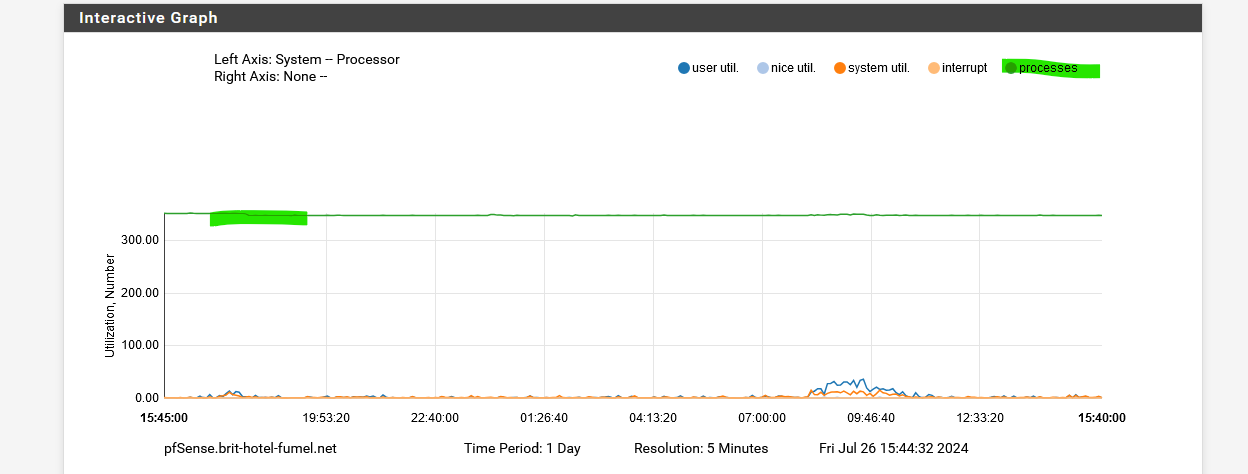
      Checking metrics something occurred on 7/24.

      f7b6c621-a557-4bf7-9d4b-80891eb26a29-image.png

      138666a0-1558-4909-8d7a-dc7e3b6ccbc3-image.png

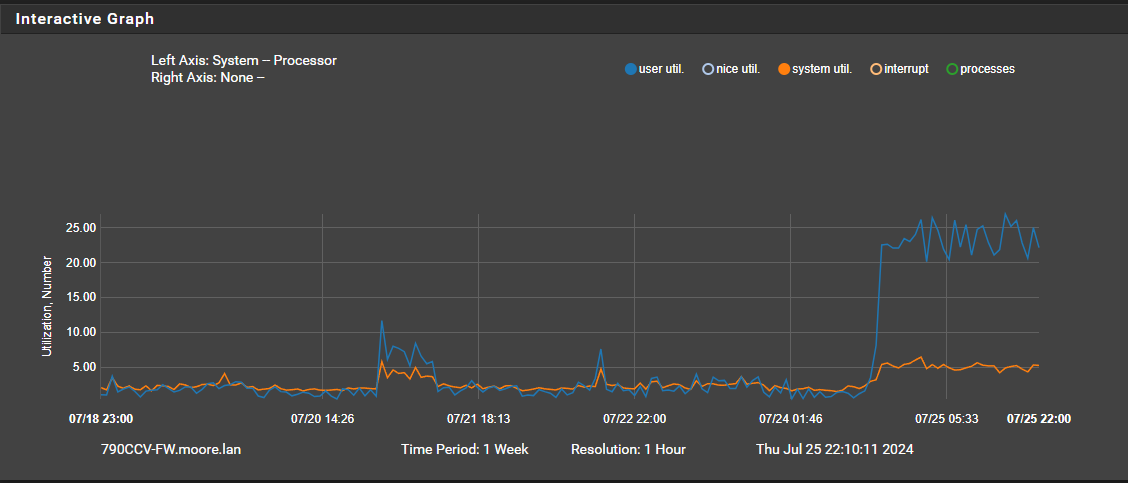
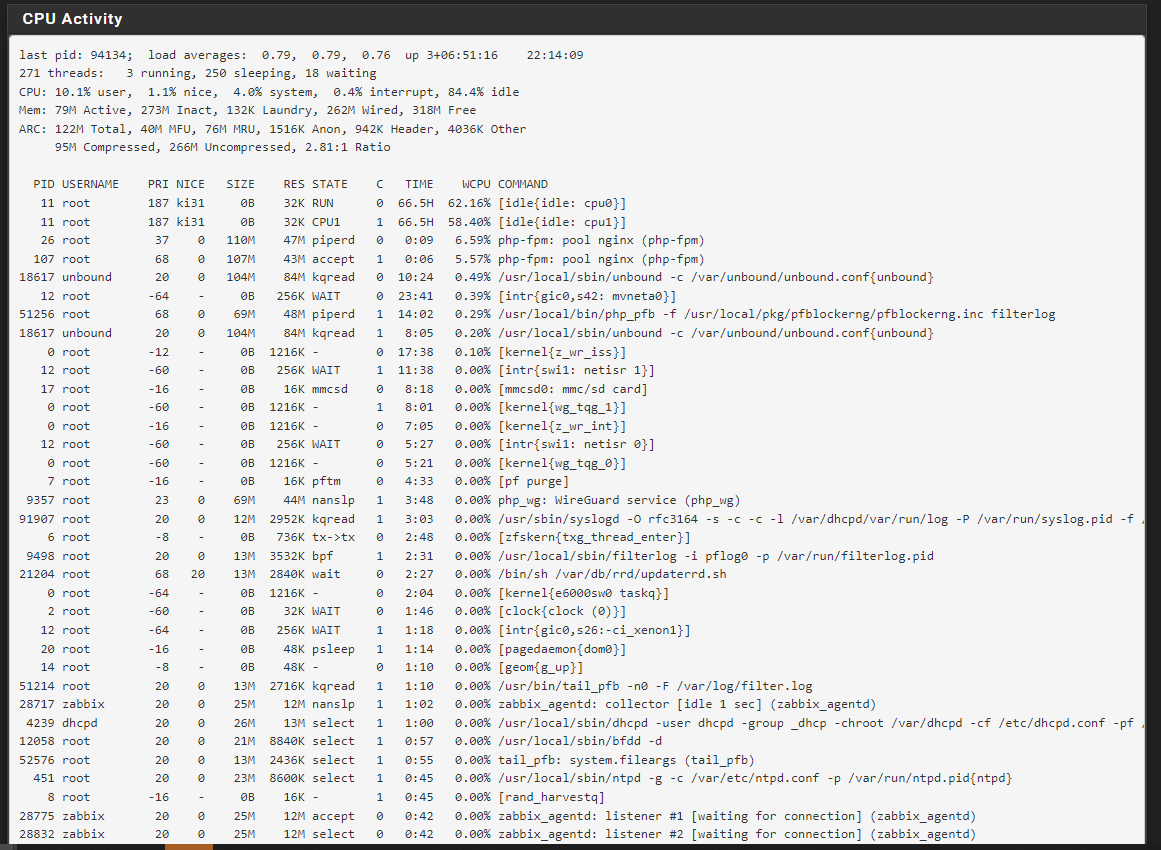
      Checking system activity I see php-fpm taking up some CPU cycles. I restarted the PHP-FPM process from cli but that didn't do anything. Any ideas?

      c6744717-e7c9-4cca-a050-8b12b4d0ed56-image.png

      Firewall: NetGate,Palo Alto-VM,Juniper SRX
      Routing: Juniper, Arista, Cisco
      Switching: Juniper, Arista, Cisco
      Wireless: Unifi, Aruba IAP
      JNCIP,CCNP Enterprise

      GertjanG keyserK 2 Replies Last reply Reply Quote 0
      • GertjanG
        Gertjan @michmoor
        last edited by

        @michmoor

        A possible reason :

        You are using pfBlockerng.
        As long as no one is using an IP or DND(BL) that is on of of the pfBlockerng feeds, all goes well - all is quiet.
        Then, a new app, person, device, whatever, is hitting resources that are listed in of of the pfBlockerng lists/feeds, and now pfBlockerng wakes up.
        Normally, IP filtering is done by pf - using lists build and generated by pfBlockerng, so very few resources are consumed.
        Same thing for DNSBL : unbound does all the heavy lifting, pfblockerng does nothing, except for updating and making a new main IP and DNSBL feed/list every xx hours (or days).

        But, as soon as some one or something starts to hit what is listed by pfBlockerng, then pfBlocker starts to do 'the other job' : making nice sharts, graphs and other GUI show stuff. And it does so using 'PHP'.
        And that will eat CPU cycles.

        Solution : disconnect your LAN 😊 (success guaranteed) or locate the device that gives a lot of work for pfBlockerng, and have a chat with the user.

        No "help me" PM's please. Use the forum, the community will thank you.
        Edit : and where are the logs ??

        M 1 Reply Last reply Reply Quote 0
        • M
          michmoor LAYER 8 Rebel Alliance @Gertjan
          last edited by

          @Gertjan pretty sure this doesn’t have anything to do with traffic (blocked or allowed) based on the system resources screenshot I posted above.

          Firewall: NetGate,Palo Alto-VM,Juniper SRX
          Routing: Juniper, Arista, Cisco
          Switching: Juniper, Arista, Cisco
          Wireless: Unifi, Aruba IAP
          JNCIP,CCNP Enterprise

          GertjanG 1 Reply Last reply Reply Quote 0
          • GertjanG
            Gertjan @michmoor
            last edited by Gertjan

            @michmoor

            Very possible.
            I can't make up a story about zabbix. I don't know what that is.
            All I see is a static image ^^

            All the other process are "base" pfSense, I have the same.

            Btw : Leaving the pfSense dashboard open in a browser also uses a lot of resources. Same reason : stats build by PHP is not a CPU friendly activity.

            edit : no processes ? : (green) :

            e0f35050-18df-4b19-9ea2-6f6c57dc0897-image.png

            Mine :

            2abc22b2-33bc-48f5-8db0-732803b8a539-image.png
            ( a hotel, 80+ devices connected right now ),

            No "help me" PM's please. Use the forum, the community will thank you.
            Edit : and where are the logs ??

            M 1 Reply Last reply Reply Quote 0
            • M
              michmoor LAYER 8 Rebel Alliance @Gertjan
              last edited by

              @Gertjan
              I didnt include processes as there was no notable change there that coincides with the increased in user and system util

              2f3209a8-3bdc-4fd4-af87-7f28c45e2b26-image.png

              Firewall: NetGate,Palo Alto-VM,Juniper SRX
              Routing: Juniper, Arista, Cisco
              Switching: Juniper, Arista, Cisco
              Wireless: Unifi, Aruba IAP
              JNCIP,CCNP Enterprise

              1 Reply Last reply Reply Quote 0
              • keyserK
                keyser Rebel Alliance @michmoor
                last edited by keyser

                @michmoor Be vary about the fact that the UI on a 2100 uses about 25% CPU power permanently as long as you have a browser open/connected and showing parts of the pfSense UI. So you might just be seeing the CPU usage of a open websession to the pfSense UI

                Same goes for the sg-1100. They both have a very low performance ARM based CPU, so PHP refresh is eating that CPU power..

                Love the no fuss of using the official appliances :-)

                M 1 Reply Last reply Reply Quote 1
                • M
                  michmoor LAYER 8 Rebel Alliance @keyser
                  last edited by

                  @keyser said in Tracing cause of cpu spike - SG1100:

                  Same goes for the sg-1100. They both have a very low performance ARM based CPU, so PHP refresh is eating that CPU power..

                  I figured that much but i don't think that's whats happening now. Its probably a bad idea to review system activity on these low-end devices because of the issue you mentioned so seeing nginx process running is me logged in.
                  I went in via the CLI and below is what I'm seeing.

                  What sort of things increase user and system utilization in a processer then as it relates to pfsense?

                  last pid:  9678;  load averages:  0.86,  0.80,  0.77                                                                                                                       up 3+21:14:32  12:37:25
                  279 threads:   4 running, 257 sleeping, 18 waiting
                  CPU: 40.5% user,  0.0% nice,  7.8% system,  0.4% interrupt, 51.4% idle
                  Mem: 110M Active, 232M Inact, 512K Laundry, 260M Wired, 330M Free
                  ARC: 124M Total, 48M MFU, 69M MRU, 1648K Anon, 931K Header, 4162K Other
                       95M Compressed, 252M Uncompressed, 2.66:1 Ratio
                  
                    PID USERNAME    PRI NICE   SIZE    RES STATE    C   TIME    WCPU COMMAND
                     11 root        187 ki31     0B    32K RUN      1  76.9H  60.90% [idle{idle: cpu1}]
                     11 root        187 ki31     0B    32K RUN      0  76.8H  43.54% [idle{idle: cpu0}]
                  51256 root         68    0    69M    39M piperd   1  18:43   1.46% /usr/local/bin/php_pfb -f /usr/local/pkg/pfblockerng/pfblockerng.inc filterlog
                  63294 unbound      20    0    99M    63M kqread   0   4:46   1.33% /usr/local/sbin/unbound -c /var/unbound/unbound.conf{unbound}
                      0 root        -12    -     0B  1216K -        0  21:10   0.88% [kernel{z_wr_iss}]
                  93399 root         20    0    14M  3692K CPU0     0   0:00   0.48% top -aSH
                      0 root        -16    -     0B  1216K -        0   8:35   0.46% [kernel{z_wr_int}]
                     17 root        -16    -     0B    16K mmcsd    0   9:56   0.40% [mmcsd0: mmc/sd card]
                     12 root        -64    -     0B   256K WAIT     1  26:50   0.34% [intr{gic0,s42: mvneta0}]
                     12 root        -60    -     0B   256K WAIT     1  13:05   0.31% [intr{swi1: netisr 1}]
                  12058 root         20    0    21M  7600K select   1   2:56   0.30% /usr/local/sbin/bfdd -d
                  63294 unbound      20    0    99M    63M kqread   1   5:34   0.26% /usr/local/sbin/unbound -c /var/unbound/unbound.conf{unbound}
                      0 root        -60    -     0B  1216K -        1   9:30   0.18% [kernel{wg_tqg_1}]
                      6 root         -8    -     0B   736K tx->tx   0   3:21   0.16% [zfskern{txg_thread_enter}]
                     12 root        -60    -     0B   256K WAIT     0   6:24   0.10% [intr{swi1: netisr 0}]
                     20 root        -16    -     0B    48K psleep   1   1:29   0.10% [pagedaemon{dom0}]


                  Firewall: NetGate,Palo Alto-VM,Juniper SRX
                  Routing: Juniper, Arista, Cisco
                  Switching: Juniper, Arista, Cisco
                  Wireless: Unifi, Aruba IAP
                  JNCIP,CCNP Enterprise

                  keyserK 1 Reply Last reply Reply Quote 0
                  • keyserK
                    keyser Rebel Alliance @michmoor
                    last edited by

                    @michmoor Very good question Indeed.
                    My first attempt would be to stop One service at a time to see if One of them indirectly is causing the issue.

                    I assume you have tried rebooting and the problem remains?

                    Love the no fuss of using the official appliances :-)

                    M 1 Reply Last reply Reply Quote 0
                    • M
                      michmoor LAYER 8 Rebel Alliance @keyser
                      last edited by

                      @keyser Yep i rebooted and the problem is there. Im going to disable pfBlocker but i cant see that being the issue.

                      Firewall: NetGate,Palo Alto-VM,Juniper SRX
                      Routing: Juniper, Arista, Cisco
                      Switching: Juniper, Arista, Cisco
                      Wireless: Unifi, Aruba IAP
                      JNCIP,CCNP Enterprise

                      keyserK 1 Reply Last reply Reply Quote 0
                      • keyserK
                        keyser Rebel Alliance @michmoor
                        last edited by

                        @michmoor just stop the services One at the time. No need to disable them

                        Love the no fuss of using the official appliances :-)

                        M 1 Reply Last reply Reply Quote 0
                        • M
                          michmoor LAYER 8 Rebel Alliance @keyser
                          last edited by

                          @keyser @Gertjan
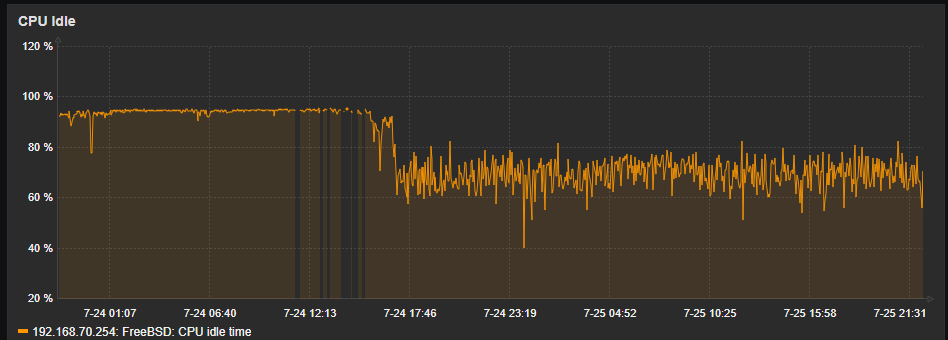
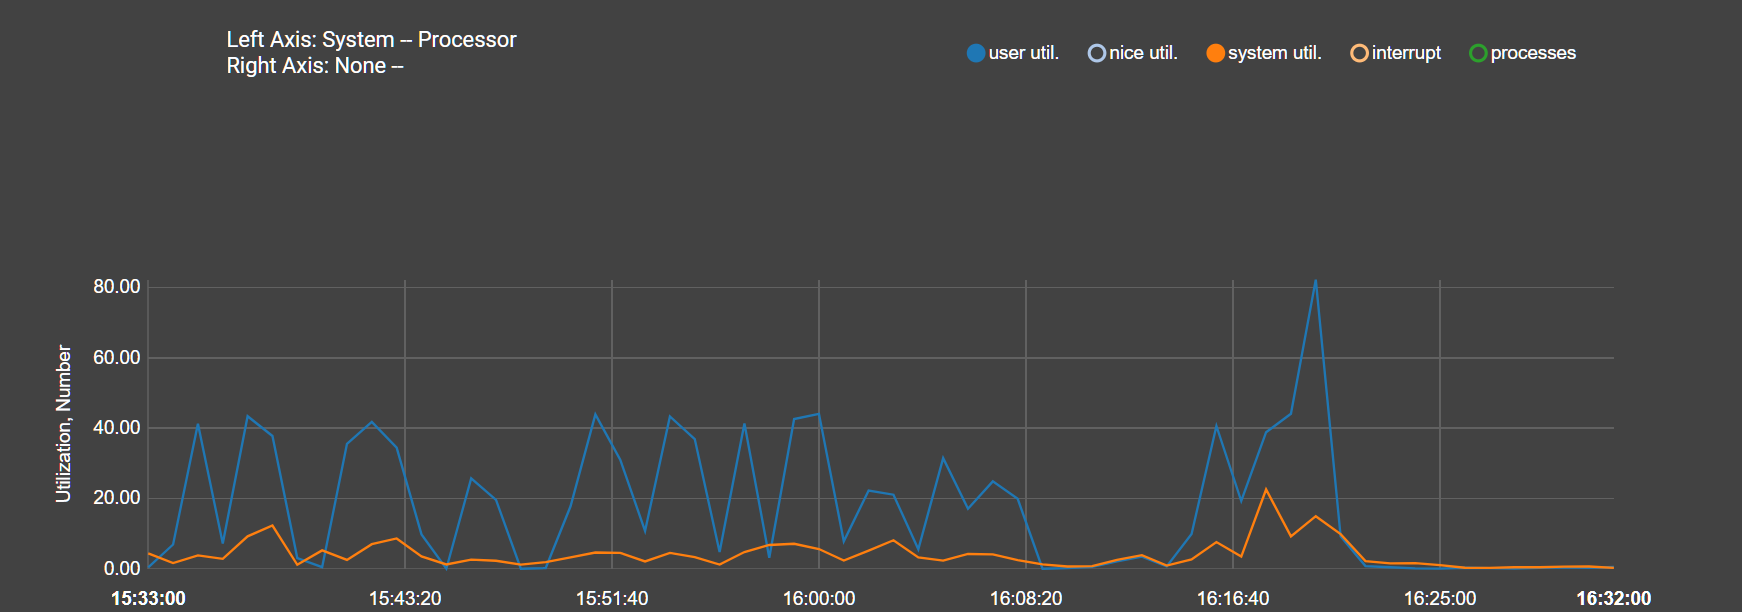
                          It was a process....it was pfBlocker. pfBlocker and Zabbix and FRR are the only packages of consequence on this 1100. Once i stopped pfblocker CPU idle shot back up to 95%.
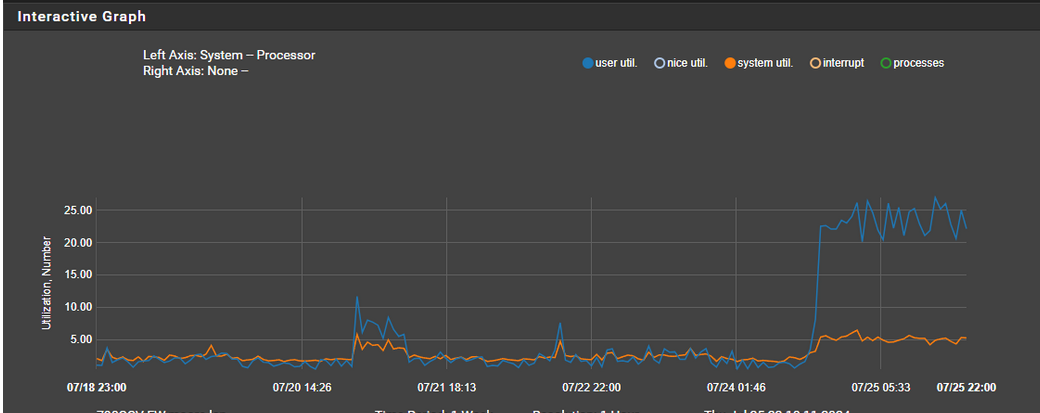
                          From the monitoring graph alone you can see system util and user util dropped
                          cb47216b-3799-40a2-ab6a-d4802afe05ce-image.png

                          So that being the case...I never deployed anything as small as an 1100 but i want to re-enable pfBlocker again.

                          Any concerns? This ARM CPU is working its butt off.

                          Firewall: NetGate,Palo Alto-VM,Juniper SRX
                          Routing: Juniper, Arista, Cisco
                          Switching: Juniper, Arista, Cisco
                          Wireless: Unifi, Aruba IAP
                          JNCIP,CCNP Enterprise

                          keyserK 1 Reply Last reply Reply Quote 0
                          • keyserK
                            keyser Rebel Alliance @michmoor
                            last edited by

                            @michmoor Good to know the culprit😊

                            There is definitively something wrong with your pfblocker config - perhaps a corrupted file or list download?
                            Pfblocker should never spend even remotely that kind of CPU - even om a 1100.

                            I have 2100 - same Arm cpu - and pfblocker has a fairly advanced config on My box. CPU usage is only about 5-8% for the whole system unless i really start pushing traffic through. And pfblocker never uses any CPU to speak off unless its updating.

                            Look into the error logfile in pfblocker (can be done in the UI)
                            Perhaps try and disable your list feeds One at a time if the pfblocker error log file does not reveal the error.

                            Love the no fuss of using the official appliances :-)

                            M 1 Reply Last reply Reply Quote 0
                            • M
                              michmoor LAYER 8 Rebel Alliance @keyser
                              last edited by

                              @keyser
                              The error logs are empty. I think this may just be a sizing issue in the end. SG1100 just isn't a powerful box and having to check a block list before creating state might be the issue.
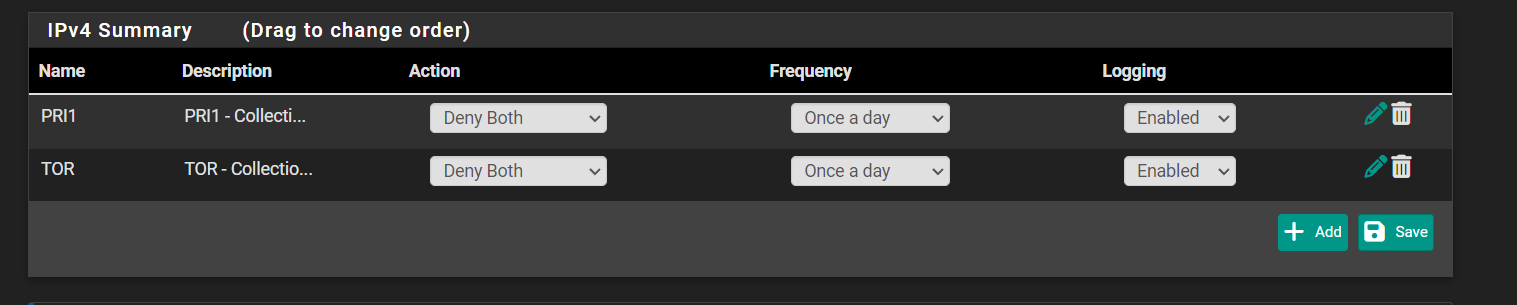
                              I don't think the list count is bad...
                              60badd49-07e7-4cbb-a335-dc70f733fbde-image.png

                              Firewall: NetGate,Palo Alto-VM,Juniper SRX
                              Routing: Juniper, Arista, Cisco
                              Switching: Juniper, Arista, Cisco
                              Wireless: Unifi, Aruba IAP
                              JNCIP,CCNP Enterprise

                              keyserK 1 Reply Last reply Reply Quote 0
                              • keyserK
                                keyser Rebel Alliance @michmoor
                                last edited by

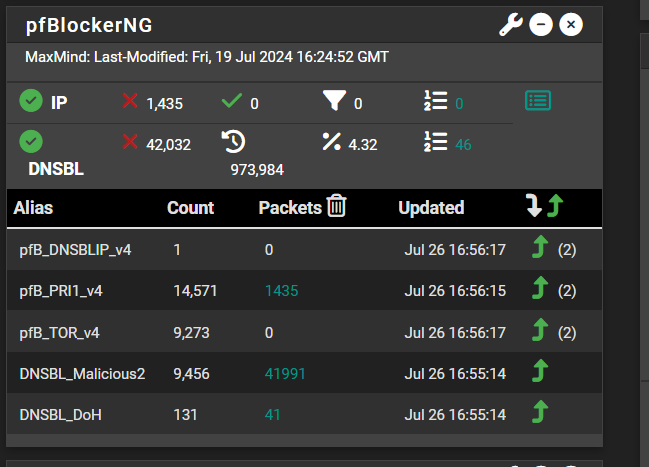
                                @michmoor That is 100% NOT the issue since pfBlocker processes are not involved in all the firewall/state stuff - that’s pfSense doing that.
                                PfBlocker processes are responsible for fetching and parsing lists, creating firewall ALIAS’es out of the lists, and if configured to create/sort the firewall rules to include rules using the ALIAS’es. The other pfBlocker process is responsible for scraping the pfSense firewall log file for entries that are created from rules that contain pfBlocker ALIAS’es - to gather information to create all the statistics reports in the pfBlocker module.

                                To compare I have these lists on a SG-2100 (Same CPU) that sees about 5-8% CPU utilisation all day exept when updating lists (once every night): 267a2b51-14d3-4e2b-8402-3d0576b557f0-image.png

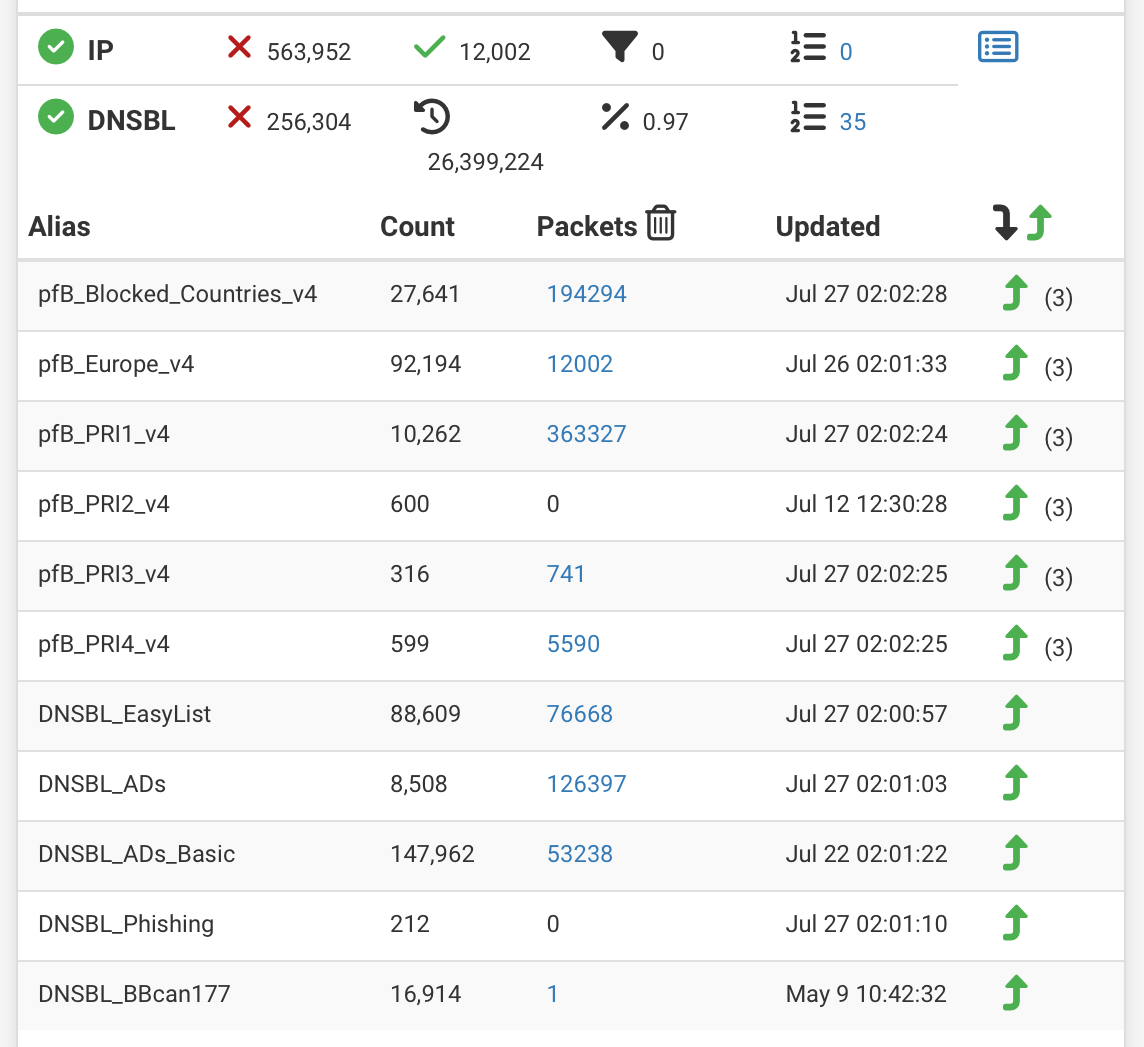
                                One guess could be that you have a LOT of firewall logging on your box (hundreds of entries a second). That logging needs not be related to pfBlocker rules specifically as it still has to scrape every log entry. That will cause pfBlocker log scraping to consuming all that CPU. If that is the case make sure to reconfigure your firewall to log A LOT less. Your eMMC (storage) will only last maybe 4 - 8 months before being dead/entering readonly mode if you are really hitting it with logs.

                                Love the no fuss of using the official appliances :-)

                                M 1 Reply Last reply Reply Quote 0
                                • M
                                  michmoor LAYER 8 Rebel Alliance @keyser
                                  last edited by

                                  @keyser hmmm ok. then something is indeed wrong but I have no clue what it is then.
                                  Traffic logging has been disabled for all firewall rules.
                                  Im not sure what else to turn off or disable for now

                                  Logging is enabled here but I don't think this would have much impact on CPU

                                  fa2ec9e1-236c-453c-8460-f4a3eb4dd3bc-image.png

                                  py_error.log file is empty
                                  error.log file only has stats from 7/4 regarding a download fail..
                                  Anything else you think I can/should check?

                                  Firewall: NetGate,Palo Alto-VM,Juniper SRX
                                  Routing: Juniper, Arista, Cisco
                                  Switching: Juniper, Arista, Cisco
                                  Wireless: Unifi, Aruba IAP
                                  JNCIP,CCNP Enterprise

                                  keyserK 1 Reply Last reply Reply Quote 0
                                  • keyserK
                                    keyser Rebel Alliance @michmoor
                                    last edited by

                                    @michmoor Not really, but It could be related to the Unbound DNS <-> DNSBL integration. I would probabaly remove the checkbox in keep settings, and then remove the package completely (with all settings).
                                    After a reboot and confirming everything is peachy, I would install the package again - check everything - do basic config (no DNSBL or lists) - check everything - enable IP blocking - check everything - configure feeds - check everything - enable DNSBL and so on and so on.

                                    To determine when in the configuration process the CPU usage arises.

                                    Love the no fuss of using the official appliances :-)

                                    M 1 Reply Last reply Reply Quote 1
                                    • M
                                      michmoor LAYER 8 Rebel Alliance @keyser
                                      last edited by

                                      @keyser Took the advice and re-installed pfblocker without keeping settings. So far so good. I have no idea what was wrong with the configuration prior. I'll keep monitoring but so far it looks good. Strange one indeed.

                                      Firewall: NetGate,Palo Alto-VM,Juniper SRX
                                      Routing: Juniper, Arista, Cisco
                                      Switching: Juniper, Arista, Cisco
                                      Wireless: Unifi, Aruba IAP
                                      JNCIP,CCNP Enterprise

                                      1 Reply Last reply Reply Quote 1
                                      • First post
                                        Last post
                                      Copyright 2025 Rubicon Communications LLC (Netgate). All rights reserved.