NAT Logs
-
For background, I have an Juniper SRX cluster. Troubleshooting an inbound IPsec connection, i was asked to verify if our extranet partner made a telnet attempt to our production IP/Port. Fair enough.
ny4vpn> show security nat source pool client-1Running the above command will give me output but what i cared about are Translation hits. This lets me know that the NAT rule is being hit (yes we NAT inbound flows).
That got me thinking....Is there any logging or is there any way to tell if in pfsense a NAT rule is being hit?
When i played with OPNsense in the past, that system does log/display if a NAT rule is being hit so curious if theres a way to check in pfsense. I wouldnt be surprised if i overlooked it but curious if theres a way to tell. -
Confused by the redmine i found
https://redmine.pfsense.org/issues/11975
This states its a duplicate of 7800
Remine 7800 says its part of "3.0"...So is this possible?
edit: If NAT logging isn't supported, then what is the workaround ?
-
On an inbound NAT rule an associated firewall rule will only be hit if NAT is happening so you can just enable logging there.
Otherwise you can use pflow data to log all connections through the firewall.
https://docs.netgate.com/pfsense/en/latest/firewall/pflow.html -
@stephenw10 I have pflow working but it doesn't have data about Source or Destination NAT at least within the Netflow v5 records. So not sure how pflow helps in this.
-
@michmoor That's expected. Netflow v5 does not support NAT44 (or IPv6 for that matter) information. Only IPFix does.
-
@kprovost Copy that. Ok i'll make adjustments to the collector.
-
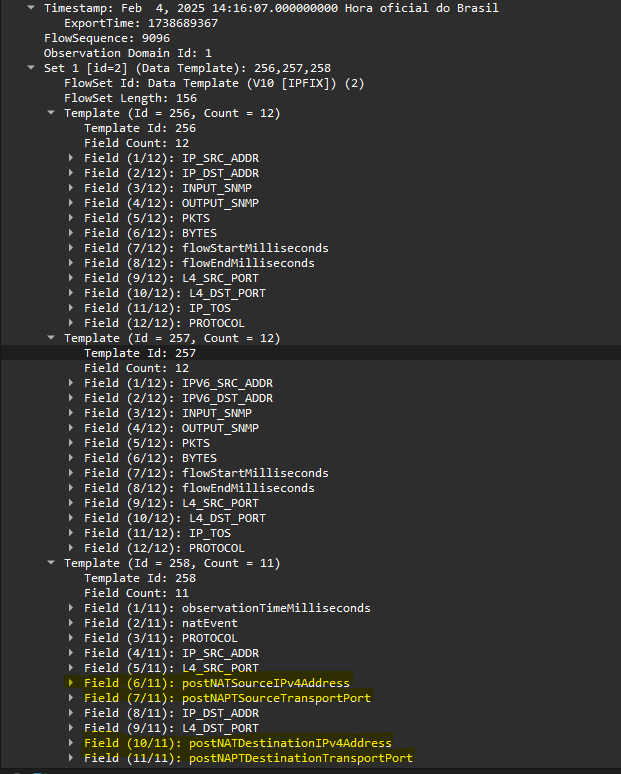
Can confirm i am seeing the additional fields using IPFix.
-
Can confirm i am seeing the additional fields using IPFix.
According to RFC 8158, the fields you need are:
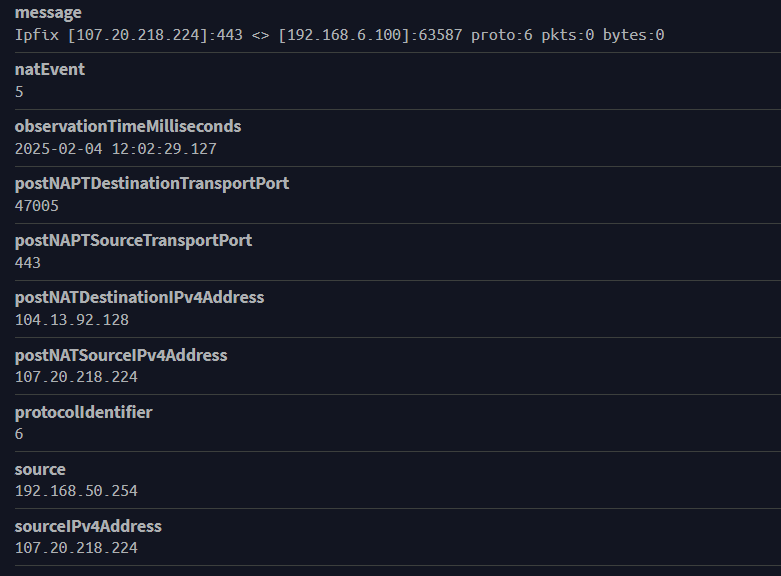
postNATSourceIPv4Address
postNAPTSourceTransportPort
postNATDestinationIPv4Address
postNAPTDestinationTransportPortI'm also playing with it right now
-
@mcury Let me know what you come up with in Graylog.
Its parsed automatically which is great but not sure how to utilize this data. Reporting?
-
-
-
So you got it.

Weird, I don't have those here.. Any tip of what I should do ? -
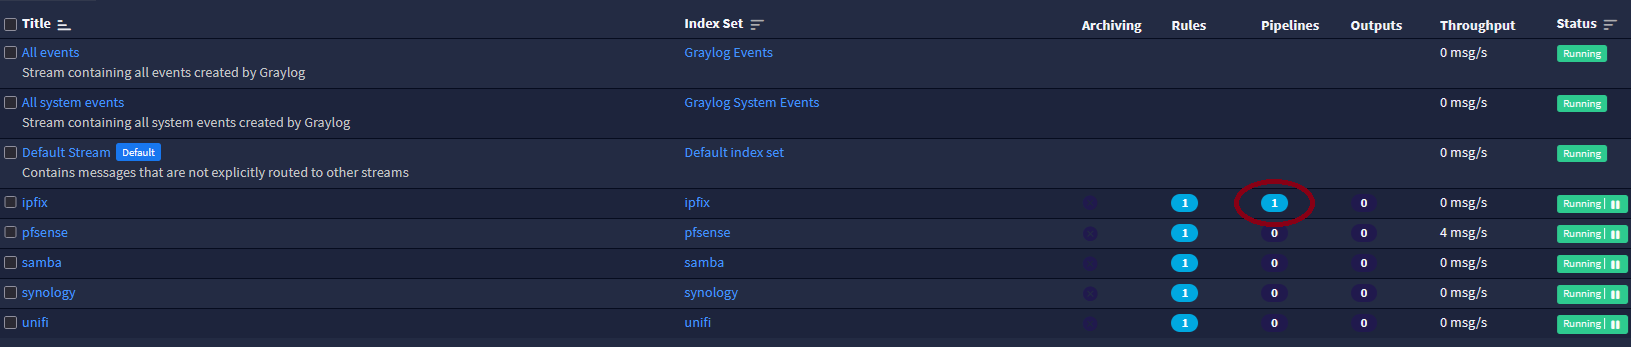
@mcury Graylog did it for me. For the input i selected IPFIX UDP
-
-
@mcury The only piece i dont know how to do is actually display data to show top talkers.
each IPfix record shows bytes which is great but i would like a table that shows all the fields plus the amount of data seen cumulative. -
The only piece i dont know how to do is actually display data to show top talkers.
each IPfix record shows bytes which is great but i would like a table that shows all the fields plus the amount of data seen cumulative.hmm, as I see it, you would nee to create a widget with the search field:
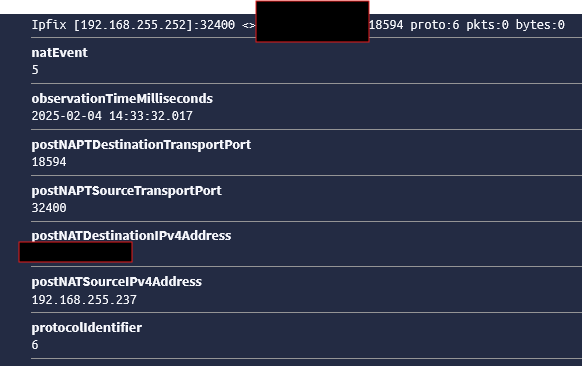
Example if the destination host is in the 192.168.255.0/24 subnet.
postNATSourceIPv4Address:192.168.255.* OR postNATDestinationIPv4Address:192.168.255.*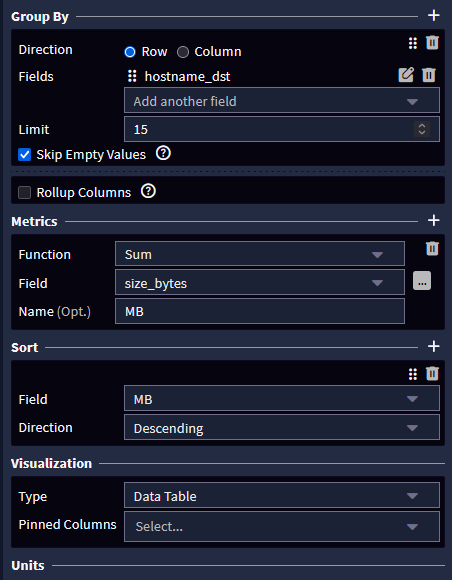
Then, as per picture above, filter by destination or source (this will give you the external users data), use SUM and Data Table.
-
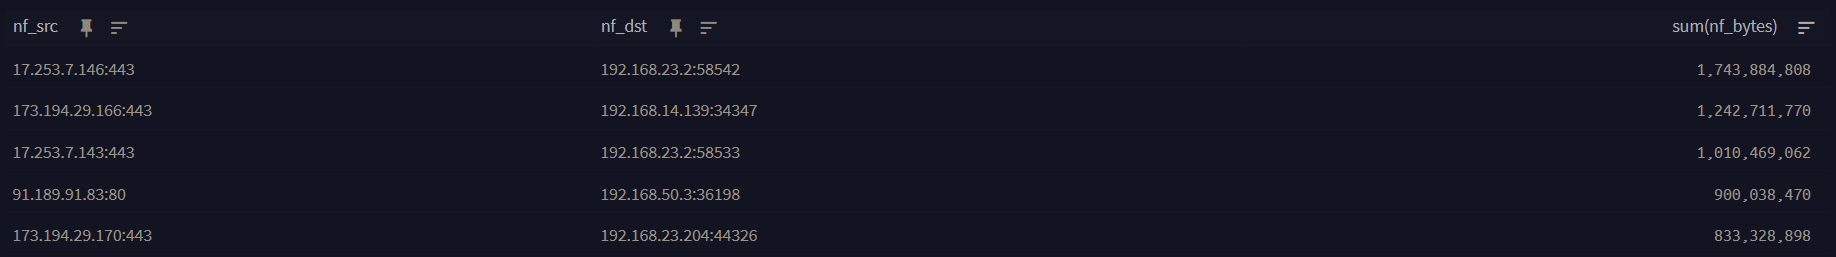
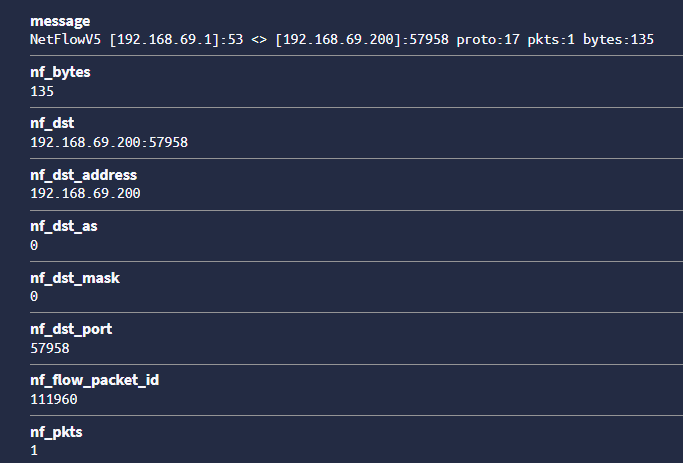
@mcury Ok yeah thats the way to go BUT....i have to use NetFlow as netflow already has bytes parsed in the output while IPFix does not.
Still figuring out how to normalize the nf_bytes column to megabytes
-
Still figuring out how to normalize the nf_bytes column to megabytes
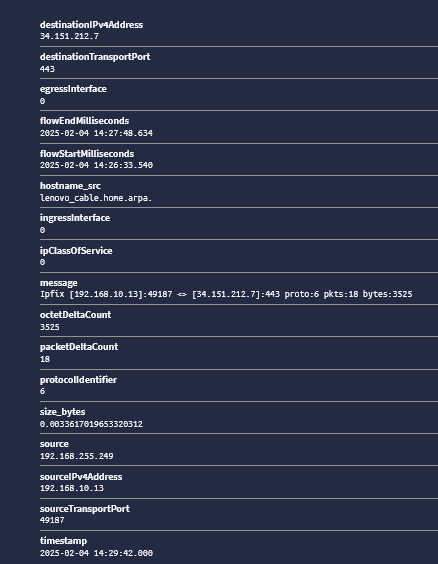
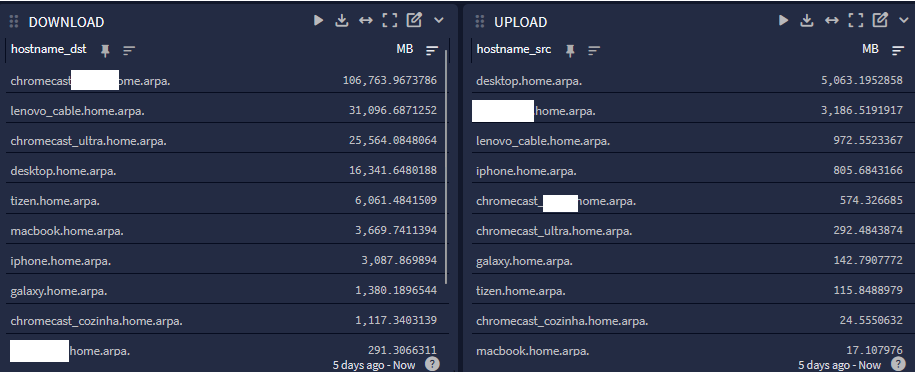
Try this pipeline rule:
rule "arithmetic"
when
has_field("octetDeltaCount")
then
let size_kb = to_double($message.octetDeltaCount);
set_field("size_bytes", size_kb / to_double(value:"1048576"));
end
This will give you something like this:
-
@mcury Not sure if its working to be honest.
There are no errors showing up in the pipeline so messages are being processed.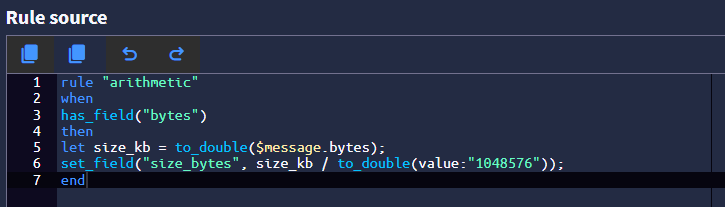
Message:
-