[solved] - Traffic Graphs: Cannot get data about interface [2.0.2]
-
Thanks, I went to look at the system.log and it's clean of any fastcgi errors. It didn't show the output from the gitsync earlier today, but I'll assume that stuff isn't logged to save space (or because I have the logger set at it's default and not in dev mode to robustly log everything). I prefer to read the logs via CLI because I like the breeze from my propellor hat. :)
Safari crashed so I didn't make it past 5h worth of logging. I restarted it and will let it run all day. I assume at this point it's fixed.
-
After gitsync, my dashboard hangs. Need to reset webconfigurator.
Been running the browser for 30 minutes and no 500 error yet but many errors in system logs.Jan 4 08:22:23 lighttpd[40989]: (mod_fastcgi.c.2676) FastCGI-stderr: ALERT - configured request variable name length limit exceeded - dropped variable 'yui:3_5_1/widget-position-constrain/widget-position-constrain-min_js' (attacker '111.111.111.111', file '/usr/local/www/sgerror.php') Jan 4 08:22:23 lighttpd[40989]: (mod_fastcgi.c.2676) FastCGI-stderr: ALERT - configured request variable name length limit exceeded - dropped variable 'yui:3_5_1/widget-position-constrain/widget-position-constrain-min_js' (attacker '111.111.111.111', file '/usr/local/www/sgerror.php') Jan 4 08:11:37 lighttpd[40989]: (mod_fastcgi.c.2676) FastCGI-stderr: ALERT - configured request variable name length limit exceeded - dropped variable 'yui:3_5_1/build/querystring-stringify-simple/querystring-stringify-simple-min_js' (attacker '111.111.111.111', file '/usr/local/www/sgerror.php') Jan 4 08:11:37 lighttpd[40989]: (mod_fastcgi.c.2676) FastCGI-stderr: ALERT - configured request variable name length limit exceeded - dropped variable 'yui:3_5_1/build/querystring-stringify-simple/querystring-stringify-simple-min_js' (attacker '111.111.111.111', file '/usr/local/www/sgerror.php') Jan 4 08:06:40 lighttpd[34122]: (mod_fastcgi.c.3002) backend died; we'll disable it for 1 seconds and send the request to another backend instead: reconnects: 1 load: 391 Jan 4 08:06:40 lighttpd[34122]: (mod_fastcgi.c.3002) backend died; we'll disable it for 1 seconds and send the request to another backend instead: reconnects: 1 load: 391 Jan 4 08:06:40 lighttpd[34122]: (mod_fastcgi.c.1732) connect failed: Connection refused on unix:/tmp/php-fastcgi.socket-0 Jan 4 08:06:40 lighttpd[34122]: (mod_fastcgi.c.1732) connect failed: Connection refused on unix:/tmp/php-fastcgi.socket-0 Jan 4 08:06:40 lighttpd[34122]: (mod_fastcgi.c.3002) backend died; we'll disable it for 1 seconds and send the request to another backend instead: reconnects: 0 load: 391 Jan 4 08:06:40 lighttpd[34122]: (mod_fastcgi.c.3002) backend died; we'll disable it for 1 seconds and send the request to another backend instead: reconnects: 0 load: 391 Jan 4 08:06:40 lighttpd[34122]: (mod_fastcgi.c.1732) connect failed: Connection refused on unix:/tmp/php-fastcgi.socket-1 Jan 4 08:06:40 lighttpd[34122]: (mod_fastcgi.c.1732) connect failed: Connection refused on unix:/tmp/php-fastcgi.socket-1 Jan 4 08:06:31 lighttpd[34122]: (mod_fastcgi.c.2760) fcgi-server re-enabled: 0 /tmp/php-fastcgi.socket Jan 4 08:06:31 lighttpd[34122]: (mod_fastcgi.c.2760) fcgi-server re-enabled: 0 /tmp/php-fastcgi.socket Jan 4 08:06:31 lighttpd[34122]: (mod_fastcgi.c.2760) fcgi-server re-enabled: 0 /tmp/php-fastcgi.socket Jan 4 08:06:31 lighttpd[34122]: (mod_fastcgi.c.2760) fcgi-server re-enabled: 0 /tmp/php-fastcgi.socket Jan 4 08:06:28 lighttpd[34122]: (mod_fastcgi.c.3002) backend died; we'll disable it for 1 seconds and send the request to another backend instead: reconnects: 1 load: 391 Jan 4 08:06:28 lighttpd[34122]: (mod_fastcgi.c.3002) backend died; we'll disable it for 1 seconds and send the request to another backend instead: reconnects: 1 load: 391 Jan 4 08:06:28 lighttpd[34122]: (mod_fastcgi.c.1732) connect failed: Connection refused on unix:/tmp/php-fastcgi.socket-0 Jan 4 08:06:28 lighttpd[34122]: (mod_fastcgi.c.1732) connect failed: Connection refused on unix:/tmp/php-fastcgi.socket-0 Jan 4 08:06:28 lighttpd[34122]: (mod_fastcgi.c.3002) backend died; we'll disable it for 1 seconds and send the request to another backend instead: reconnects: 0 load: 391 Jan 4 08:06:28 lighttpd[34122]: (mod_fastcgi.c.3002) backend died; we'll disable it for 1 seconds and send the request to another backend instead: reconnects: 0 load: 391 Jan 4 08:06:28 lighttpd[34122]: (mod_fastcgi.c.1732) connect failed: Connection refused on unix:/tmp/php-fastcgi.socket-1 Jan 4 08:06:28 lighttpd[34122]: (mod_fastcgi.c.1732) connect failed: Connection refused on unix:/tmp/php-fastcgi.socket-1 Jan 4 08:06:26 lighttpd[34122]: (mod_fastcgi.c.2760) fcgi-server re-enabled: 0 /tmp/php-fastcgi.socket Jan 4 08:06:26 lighttpd[34122]: (mod_fastcgi.c.2760) fcgi-server re-enabled: 0 /tmp/php-fastcgi.socket Jan 4 08:06:26 lighttpd[34122]: (mod_fastcgi.c.2760) fcgi-server re-enabled: 0 /tmp/php-fastcgi.socket Jan 4 08:06:26 lighttpd[34122]: (mod_fastcgi.c.2760) fcgi-server re-enabled: 0 /tmp/php-fastcgi.socket -
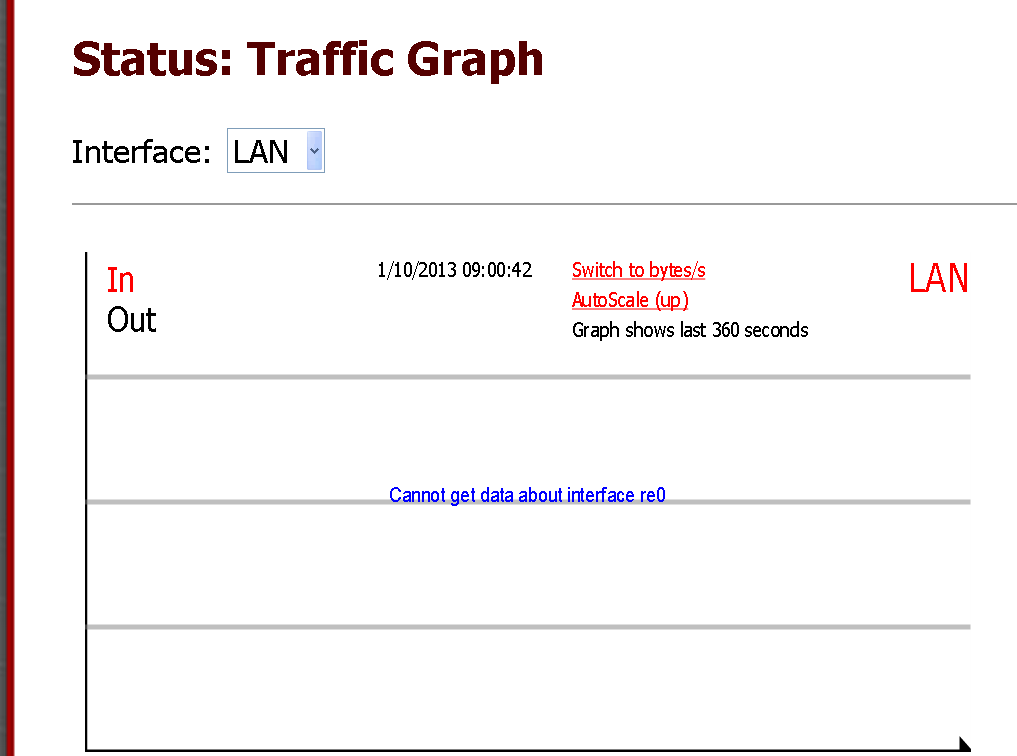
I had a little freeze a moment ago when trying to browse to 'Status/Traffic Graph', a reboot fixed that as I hadnt rebooted all day since I GitSynced, I returned to 'Status/Traffic Graph' to make sure it wasnt the cause. Reboot if you havent done so.
If youre referring to
FastCGI-stderr: ALERT
I am also seeing this, the cause of mine is the portal page I have uploaded that has a link to google.com, I notice in your log that the cause of the alert is dashboard widgets, both show that the variable name length is set too short and causing that alert.
When it happens to me, I am guessing my captive portal user clicks the www.google.com link and gets redirected to the captive portal login page and because cp appends additional info to the url, that causes the error, I'm no coder but could a dev confirm if this might be the case?
-
My system log is now full of```
lighttpd[35079]: (mod_fastcgi.c.2676) FastCGI-stderr: ALERT -3 hours running and my traffic graphs are okay for the time being. Except for that above error. I have no redirect page or captive portal. My packages: squid, squidguard, lightsquid, vnstat2, imspector, mailreport and sarg. Although i have traffic limiter for my network, 2 WANs and 2 LANs. -
Like I said earlier, in your case it seems to be a dashboard widget, what widgets do you have enabled? also I noticed in the original log you posted the attacker IP is '111.111.111.111' I am guessing this is the client you use to administer pfsense.
-
A lot of whiskey, beer, and hours later and my graphs are plugging away swimmingly.
IMHO, this is resolved for my installation.
Many thanks again, and I raise a glass!
-
@Abdsalem:
Like I said earlier, in your case it seems to be a dashboard widget, what widgets do you have enabled? also I noticed in the original log you posted the attacker IP is '111.111.111.111' I am guessing this is the client you use to administer pfsense.
My widgets are: traffic graphs, gateways, interfaces, IPSec and System Information.
The 111.111.111.111 is a bogus IP I edited in replacement to my WAN IP. The log shows my WAN IP but I don't like to post it so I made it to 111.111.111.111 -
I have a feeling if you remove the IPsec widget the error will disappear….
The original bug posted in this thread is also fixed for me and the bug we both experience I feel is something seperate, I think it needs its own thread.
-
you are correct, the IPSec and the System Information widgets created the whole errors.
I think the Uptime bar on the system information is the culprit, because I just installed a 2.0.2 on a new box and on IE, it showed some error.
input style="border: 0px solid white;" size="30" name="uptime" id="uptime" value=" Fatal error: Call to undefined function get_uptime() in /usr/local/www/widgets/widgets/system_information.widget.php on line 159 -
I want to edit my first post to put "SOLVED" on it but it seems that option is not available.
I checked and rechecked again where the edit/modify button is, but i cant find it any longer.Anyway, Abdsalem's solution seems to work:
pfSsh.php playback gitsync RELENG_2_0Although the 500 errors don't show up, the solution produces different errors on the syslog, but that is another issue which is here:
http://forum.pfsense.org/index.php/topic,57363.msg306384.html#msg306384Thanks again to everyone for your help.
Cheers.EDIT: it's weird, i can edit my last post but there is no MODIFY button on my previous posts. ???
-
i can edit my last post but there is no MODIFY button on my previous posts. ???
The "modify" option expires on "old enough" posts?
-
i dunno. how old is old? ???
cmb edited the first post to put the word "solved".
tnx cmb. -
i dunno. how old is old? ???
Evidence suggests the Modify link disappears from the author's view of a post after a time less than
3660 hours. -
hope the dev team will not consider this BUG as solve, as it still exist even in NEW installation(2.0.2)….
-
It is solved in 2.0.3.
We haven't made the new release yet.
-
-
Thanks! Just my DASHBOARD keep saying I am on the latest release, it just don't show that i'm not updated.
Thanks and more power!
-br
@jimp:It is solved in 2.0.3.
We haven't made the new release yet.
-
Thanks! Just my DASHBOARD keep saying I am on the latest release, it just don't show that i'm not updated.
Thanks and more power!
-brThats cos you are, until 2.0.3 gets officially released.
-
It is solved in 2.0.3.
We haven't made the new release yet.
If it's the same issue I'm having, it may not be fixed in 2.0.3
(FYI: This is a fresh system that began as an install of 2.0.2-RELEASE (i386)
I upgraded to 2.0.3 in an effort to fix the TG widget. )In my Traffic Graphs widget, the LAN window resorts to being minimized after being saved.
Before Save Settings

After Save Settings

Likewise if I click the Traffic Graphs wrench -> adjust the refresh interval -> click the Save Settings button -> Nothing happens.
The button will depress but the widget doesn't seem to acknowledge it.

I've followed this thread through; I've tried everything I've read but nothing has made an impact.
I miss my traffic widget.
I'll poke around a little more but I probably need some guidance to fix this.
Thanks for any help. -
Not the same issue. And that's been asked/answered a few times already in other 2.0.2 threads.