Status -> Monitoring shows no activity
-
@kevindd992002
I have seen that, too. Monitoring depends on the RRD data accumulated and that I dependent on correct time. Make sure your NTP is in sync. That's all I got. -
@provels said in Status -> Monitoring shows no activity:
@kevindd992002
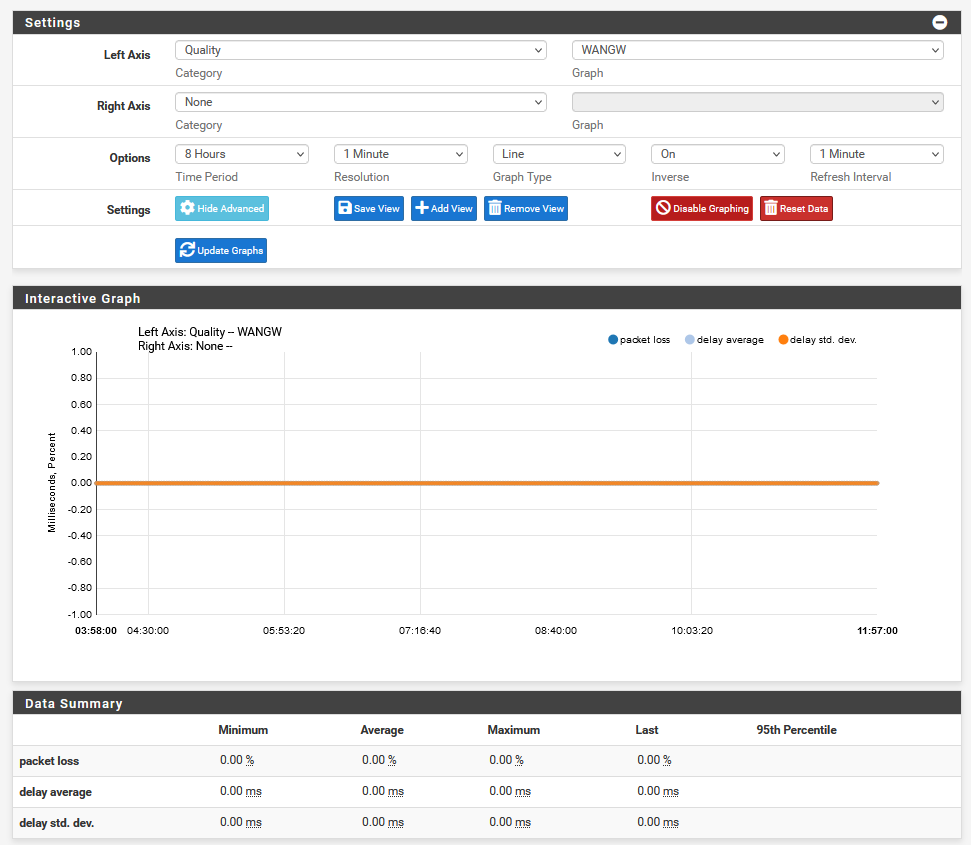
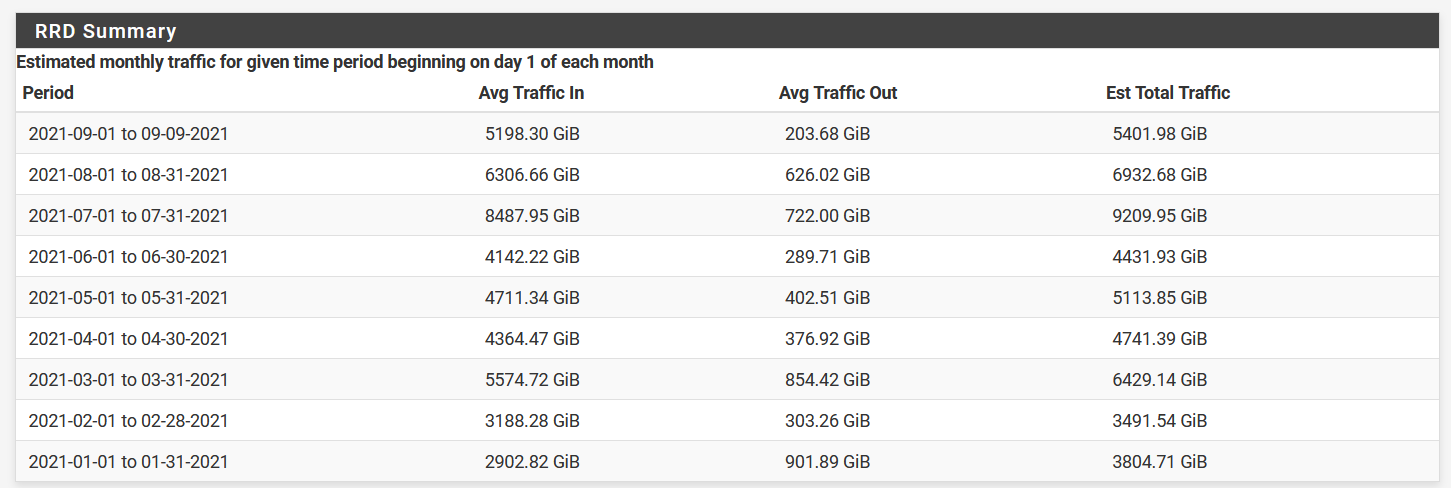
I have seen that, too. Monitoring depends on the RRD data accumulated and that I dependent on correct time. Make sure your NTP is in sync. That's all I got.Well, I do have RRD data:
And my time servers are set as such:

-
That's usually because it's not actually using that gateway. If the gateway is renamed or replaced the old 'WANGW` entry will still exist (the RRD file is there) but no longer updated.
The default gateway name would be WAN_DHCP for new installs.Steve
-
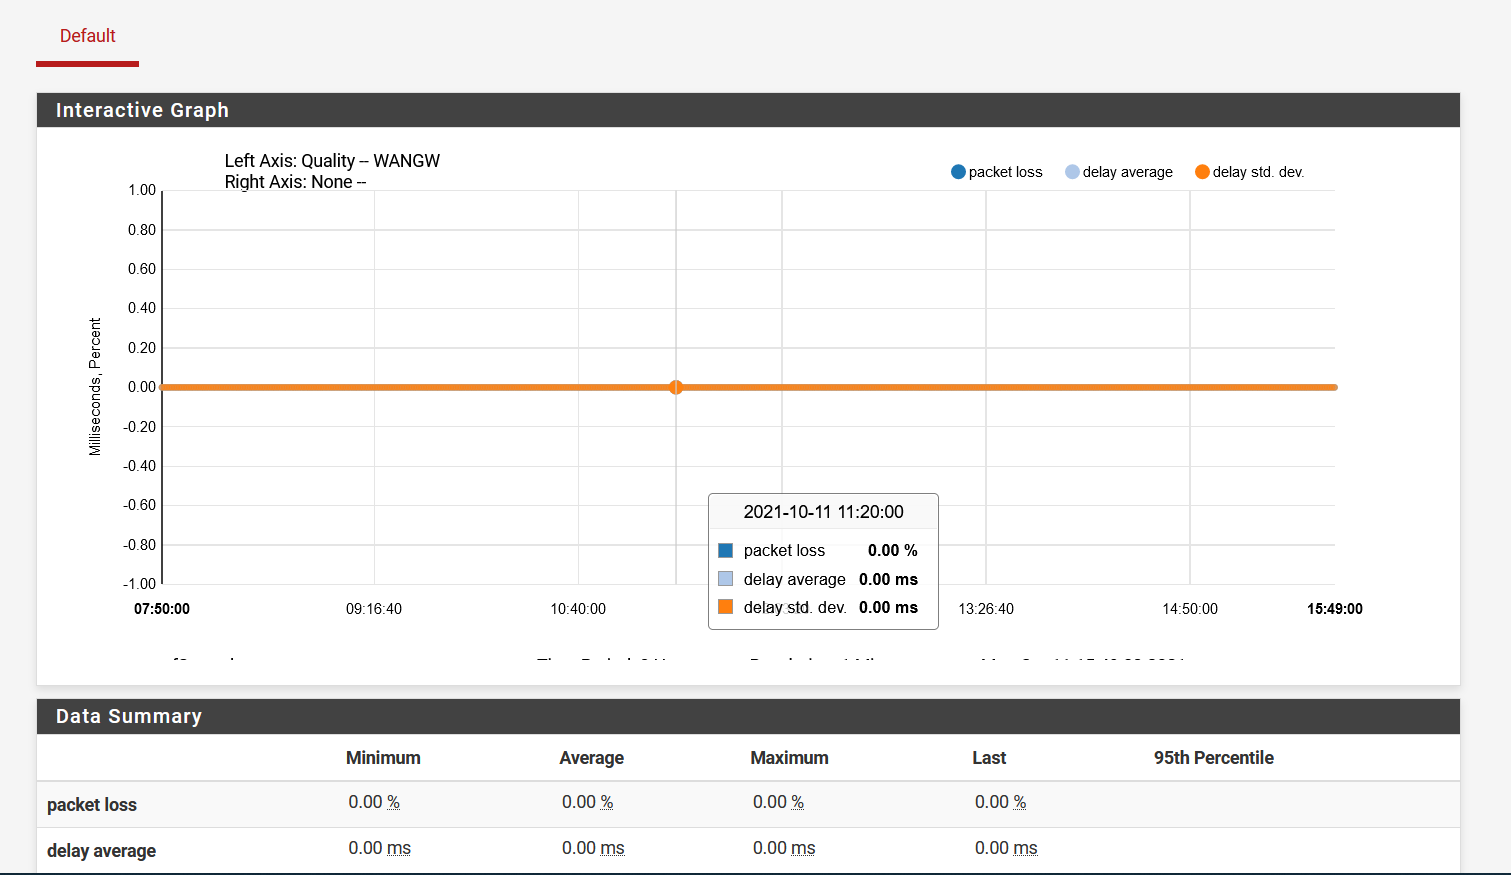
@stephenw10 it is definitely using the WANGW gateway as the default one. I only have one WAN gateway and one WireGuard S2S gateway. Even the Wireguard doesn't have any data:
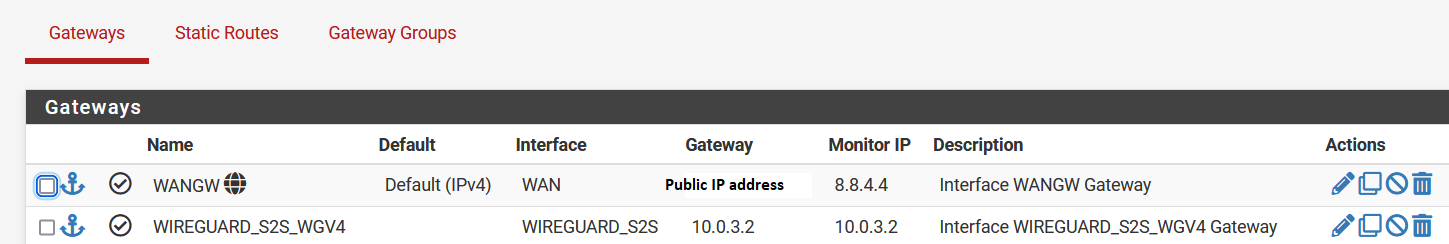
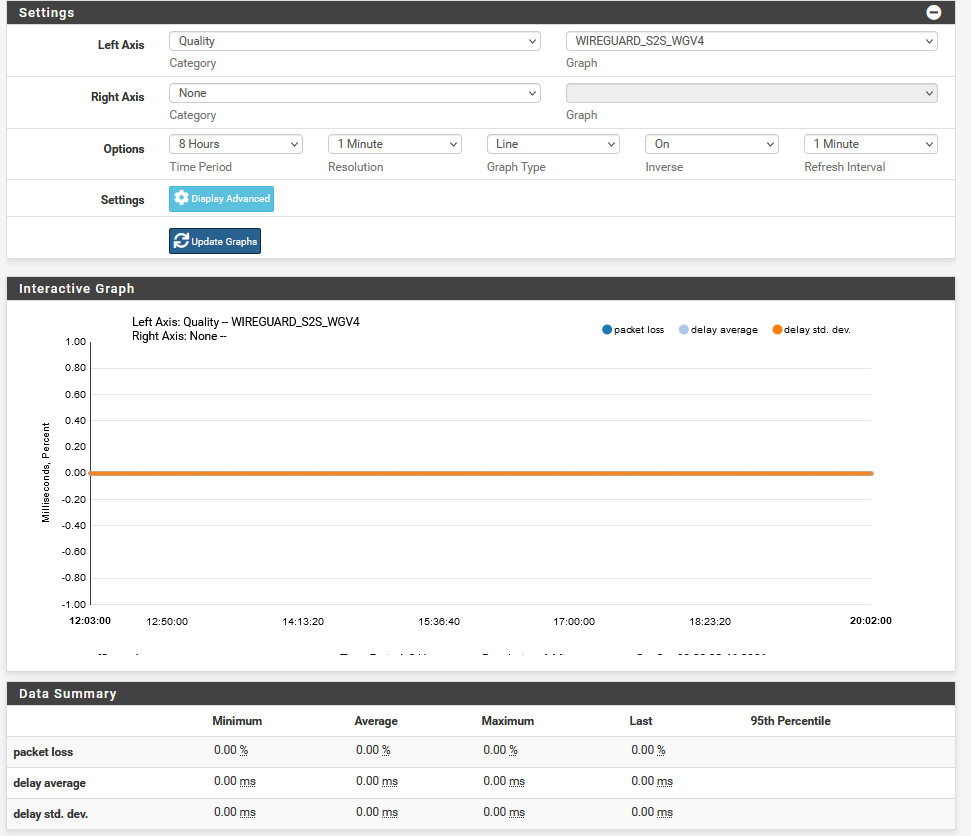
And this isn't a new install, if that matters.
-
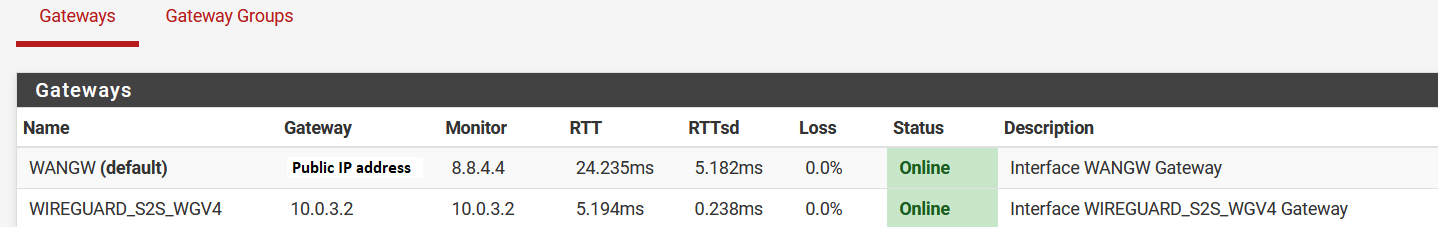
And it is creating quality data for those interfaces? You see pings times etc in Status > Gateways?
Steve
-
@stephenw10 said in Status -> Monitoring shows no activity:
And it is creating quality data for those interfaces? You see pings times etc in Status > Gateways?
Steve
Yes.
-
Then I would reset the RRD data at that point.
-
@stephenw10 said in Status -> Monitoring shows no activity:
Then I would reset the RRD data at that point.
And what's the correct process to do that?
-
There's a button for it in System > Monitoring > Settings. In your first screenshot above.
Steve
-
@stephenw10 said in Status -> Monitoring shows no activity:
There's a button for it in System > Monitoring > Settings. In your first screenshot above.
Steve
Ok, I just did that. How long do the RRD files get generated with useful data? Right now, I have a blank graph area and the Graph field doesn't show anything that I could choose from.
-
I believe 1h is the shortest interval it can attempt to display so I would wait at least that long.
-
@stephenw10 said in Status -> Monitoring shows no activity:
I believe 1h is the shortest interval it can attempt to display so I would wait at least that long.
Well, it's the same thing after resetting:
-
Have a look at the rrd file :
ls -alrt /var/db/rrd/This command will revers list, with details, all the rrd files.
Are the time stamps all very recent ?
Like :
.... -rw-r--r-- 1 nobody wheel 393168 Oct 11 10:30 ipsec-traffic.rrd -rw-r--r-- 1 nobody wheel 393168 Oct 11 10:30 ipsec-packets.rrd -rw-r--r-- 1 nobody wheel 393168 Oct 11 10:30 ovpns1-traffic.rrd -rw-r--r-- 1 nobody wheel 393168 Oct 11 10:30 ovpns1-packets.rrd -rw-r--r-- 1 nobody wheel 49720 Oct 11 10:30 ovpns1-vpnusers.rrd -rw-r--r-- 1 nobody wheel 245976 Oct 11 10:30 system-states.rrd -rw-r--r-- 1 nobody wheel 245976 Oct 11 10:30 system-processor.rrd -rw-r--r-- 1 nobody wheel 735320 Oct 11 10:30 system-memory.rrd -rw-r--r-- 1 nobody wheel 588592 Oct 11 10:30 system-mbuf.rrd -rw-r--r-- 1 nobody wheel 197752 Oct 11 10:30 captiveportal-cpzone1-concurrent.rrd -rw-r--r-- 1 nobody wheel 197752 Oct 11 10:30 captiveportal-cpzone1-loggedin.rrd -rw-r--r-- 1 nobody wheel 882048 Oct 11 10:30 ntpd.rrd -rw-r--r-- 1 nobody wheel 441864 Oct 11 10:30 lan-dhcpd.rrd -rw-r--r-- 1 nobody wheel 441864 Oct 11 10:30 opt1-dhcpd.rrd -rw-r--r-- 1 nobody wheel 71216 Oct 11 10:30 AP1-quality.rrd -rw-r--r-- 1 nobody wheel 71216 Oct 11 10:30 AP2-quality.rrd -rw-r--r-- 1 nobody wheel 147848 Oct 11 10:30 AP3-quality.rrd -rw-r--r-- 1 nobody wheel 147848 Oct 11 10:30 HE_TUN_TUNNELV6-quality.rrd -rw-r--r-- 1 nobody wheel 147848 Oct 11 10:30 OPENVPN_VPNV4-quality.rrd -rw-r--r-- 1 nobody wheel 147848 Oct 11 10:30 OPENVPN_VPNV6-quality.rrd -rw-r--r-- 1 nobody wheel 147848 Oct 11 10:30 WAN_DHCP-quality.rrd -
@gertjan said in Status -> Monitoring shows no activity:
ls -alrt /var/db/rrd/
Yes, I see very recent files:
[2.5.2-RELEASE][root@pfSense.home.arpa]/root: ls -alrt /var/db/rrd/ total 13700 drwxr-xr-x 2 nobody wheel 1536 Oct 11 03:25 . -rw-r--r-- 1 root wheel 15895 Oct 11 11:50 updaterrd.sh -rw-r--r-- 1 nobody wheel 441864 Oct 12 16:53 opt2-dhcpd.rrd -rw-r--r-- 1 nobody wheel 441864 Oct 12 17:54 opt3-dhcpd.rrd drwxr-xr-x 6 root wheel 512 Oct 12 18:50 .. -rw-r--r-- 1 nobody wheel 441864 Oct 12 18:55 opt4-dhcpd.rrd -rw-r--r-- 1 nobody wheel 441864 Oct 12 19:56 opt5-dhcpd.rrd -rw-r--r-- 1 nobody wheel 147848 Oct 12 19:56 OPENVPN_RA_VPNV4-quality.rrd -rw-r--r-- 1 nobody wheel 147848 Oct 12 19:56 WANGW-quality.rrd -rw-r--r-- 1 nobody wheel 147848 Oct 12 19:56 WIREGUARD_S2S_WGV4-quality.rrd -rw-r--r-- 1 nobody wheel 393168 Oct 12 19:57 wan-traffic.rrd -rw-r--r-- 1 nobody wheel 393168 Oct 12 19:57 wan-packets.rrd -rw-r--r-- 1 nobody wheel 393168 Oct 12 19:57 opt2-traffic.rrd -rw-r--r-- 1 nobody wheel 393168 Oct 12 19:57 opt2-packets.rrd -rw-r--r-- 1 nobody wheel 393168 Oct 12 19:57 opt3-traffic.rrd -rw-r--r-- 1 nobody wheel 393168 Oct 12 19:57 opt3-packets.rrd -rw-r--r-- 1 nobody wheel 393168 Oct 12 19:57 opt4-traffic.rrd -rw-r--r-- 1 nobody wheel 393168 Oct 12 19:57 opt4-packets.rrd -rw-r--r-- 1 nobody wheel 393168 Oct 12 19:57 opt5-traffic.rrd -rw-r--r-- 1 nobody wheel 393168 Oct 12 19:57 opt5-packets.rrd -rw-r--r-- 1 nobody wheel 393168 Oct 12 19:57 opt6-traffic.rrd -rw-r--r-- 1 nobody wheel 393168 Oct 12 19:57 opt6-packets.rrd -rw-r--r-- 1 nobody wheel 393168 Oct 12 19:57 opt8-traffic.rrd -rw-r--r-- 1 nobody wheel 393168 Oct 12 19:57 opt8-packets.rrd -rw-r--r-- 1 nobody wheel 393168 Oct 12 19:57 opt9-traffic.rrd -rw-r--r-- 1 nobody wheel 393168 Oct 12 19:57 opt9-packets.rrd -rw-r--r-- 1 nobody wheel 393168 Oct 12 19:57 ipsec-traffic.rrd -rw-r--r-- 1 nobody wheel 393168 Oct 12 19:57 ipsec-packets.rrd -rw-r--r-- 1 nobody wheel 393168 Oct 12 19:57 ovpns2-traffic.rrd -rw-r--r-- 1 nobody wheel 393168 Oct 12 19:57 ovpns2-packets.rrd -rw-r--r-- 1 nobody wheel 49720 Oct 12 19:57 ovpns2-vpnusers.rrd -rw-r--r-- 1 nobody wheel 393168 Oct 12 19:57 ovpns1-traffic.rrd -rw-r--r-- 1 nobody wheel 393168 Oct 12 19:57 ovpns1-packets.rrd -rw-r--r-- 1 nobody wheel 49720 Oct 12 19:57 ovpns1-vpnusers.rrd -rw-r--r-- 1 nobody wheel 245976 Oct 12 19:57 system-states.rrd -rw-r--r-- 1 nobody wheel 245976 Oct 12 19:57 system-processor.rrd -rw-r--r-- 1 nobody wheel 735320 Oct 12 19:57 system-memory.rrd -rw-r--r-- 1 nobody wheel 588592 Oct 12 19:57 system-mbuf.rrd -rw-r--r-- 1 nobody wheel 882048 Oct 12 19:57 ntpd.rrd -
I assume you see no data for the OpenVPN gateway either?
-
@stephenw10 said in Status -> Monitoring shows no activity:
I assume you see no data for the OpenVPN gateway either?
Correct.
-
Correct time and date on the box? I've seen some odd things happen there when it tries to display data from the wrong time etc. I haven't seen anything like that in 2.5.2 though.
-
@stephenw10 said in Status -> Monitoring shows no activity:
Correct time and date on the box? I've seen some odd things happen there when it tries to display data from the wrong time etc. I haven't seen anything like that in 2.5.2 though.
Yes, time and date synced with NTP servers. I haven't seen any time issues with this box when I'm checking logs. They seem to be on point.
-
Hmm, must be something different. Any errors logged when you open the graphs?
-
@stephenw10 said in Status -> Monitoring shows no activity:
Hmm, must be something different. Any errors logged when you open the graphs?
This is all I see under System Logs -> System -> GUI Service when I open monitoring:
Oct 13 10:37:41 	nginx 		192.168.20.251 - - [13/Oct/2021:10:37:41 +0800] "POST /rrd_fetch_json.php HTTP/2.0" 200 5401 "https://192.168.10.1/status_monitoring.php" "Mozilla/5.0 (Windows NT 10.0; Win64; x64; rv:93.0) Gecko/20100101 Firefox/93.0"
Oct 13 10:37:40 	nginx 		192.168.20.251 - - [13/Oct/2021:10:37:40 +0800] "GET /status_monitoring.php HTTP/2.0" 200 15458 "https://192.168.10.1/status_monitoring.php" "Mozilla/5.0 (Windows NT 10.0; Win64; x64; rv:93.0) Gecko/20100101 Firefox/93.0"