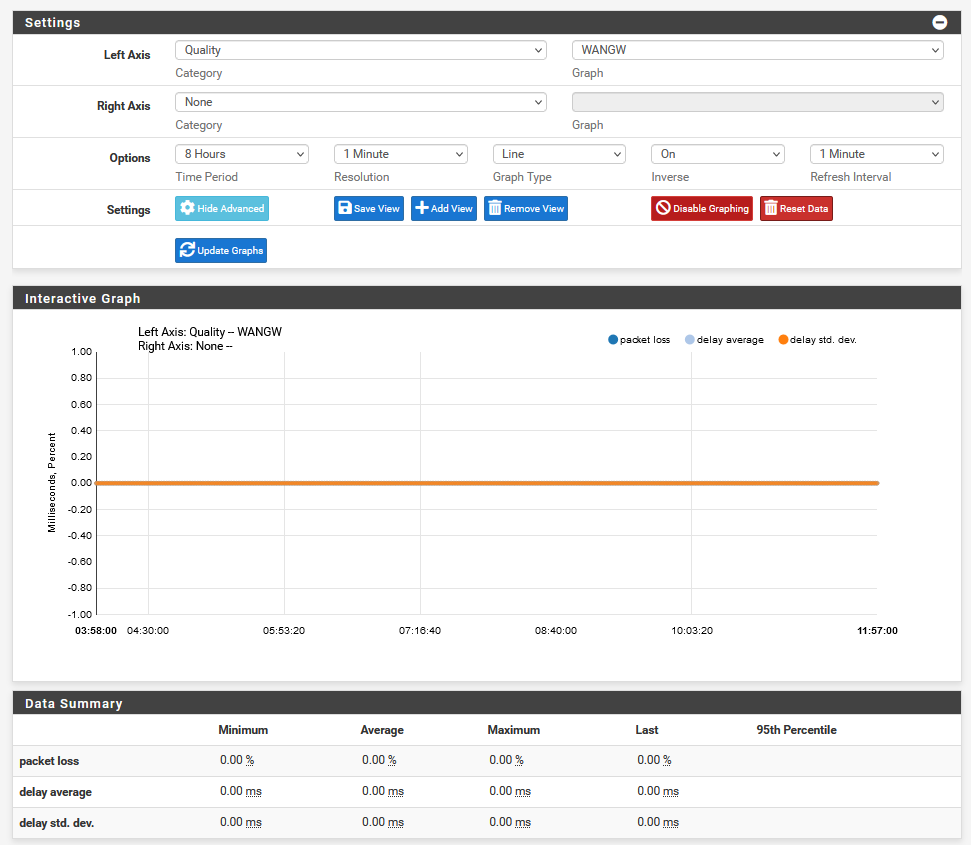
Status -> Monitoring shows no activity
-
That's usually because it's not actually using that gateway. If the gateway is renamed or replaced the old 'WANGW` entry will still exist (the RRD file is there) but no longer updated.
The default gateway name would be WAN_DHCP for new installs.Steve
-
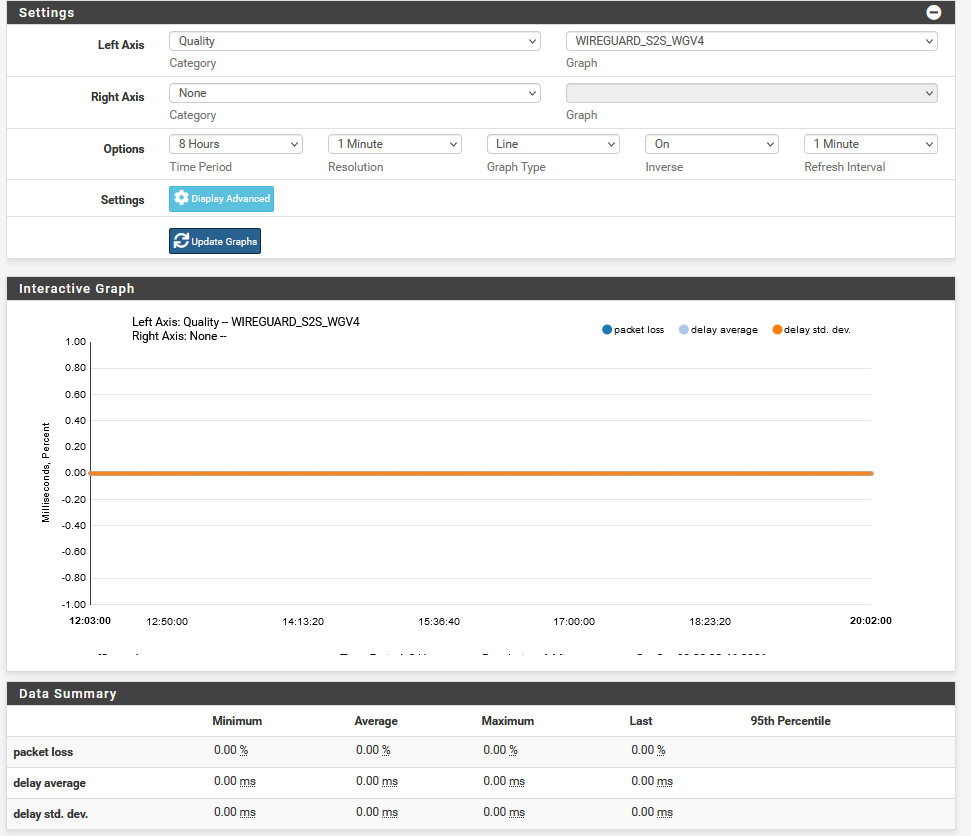
@stephenw10 it is definitely using the WANGW gateway as the default one. I only have one WAN gateway and one WireGuard S2S gateway. Even the Wireguard doesn't have any data:
And this isn't a new install, if that matters.
-
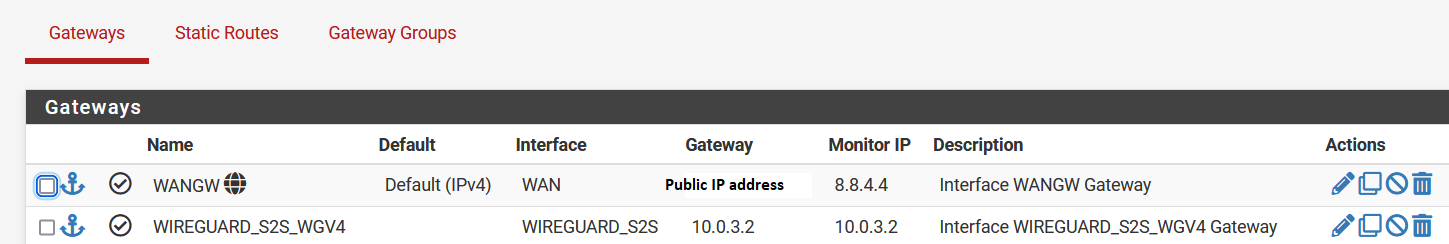
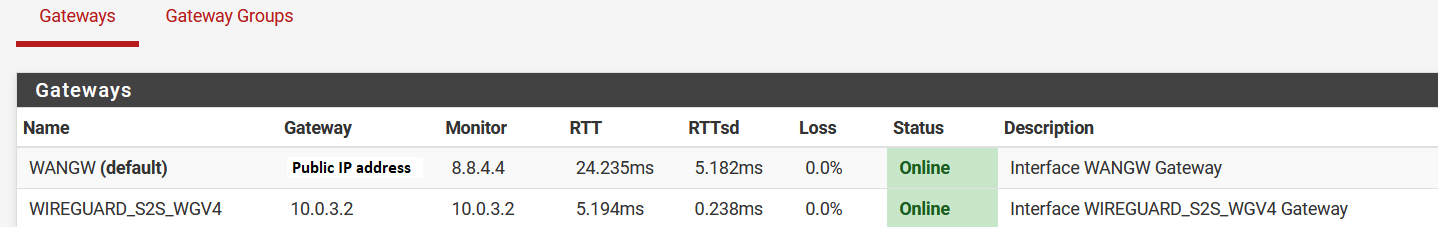
And it is creating quality data for those interfaces? You see pings times etc in Status > Gateways?
Steve
-
@stephenw10 said in Status -> Monitoring shows no activity:
And it is creating quality data for those interfaces? You see pings times etc in Status > Gateways?
Steve
Yes.
-
Then I would reset the RRD data at that point.
-
@stephenw10 said in Status -> Monitoring shows no activity:
Then I would reset the RRD data at that point.
And what's the correct process to do that?
-
There's a button for it in System > Monitoring > Settings. In your first screenshot above.
Steve
-
@stephenw10 said in Status -> Monitoring shows no activity:
There's a button for it in System > Monitoring > Settings. In your first screenshot above.
Steve
Ok, I just did that. How long do the RRD files get generated with useful data? Right now, I have a blank graph area and the Graph field doesn't show anything that I could choose from.
-
I believe 1h is the shortest interval it can attempt to display so I would wait at least that long.
-
@stephenw10 said in Status -> Monitoring shows no activity:
I believe 1h is the shortest interval it can attempt to display so I would wait at least that long.
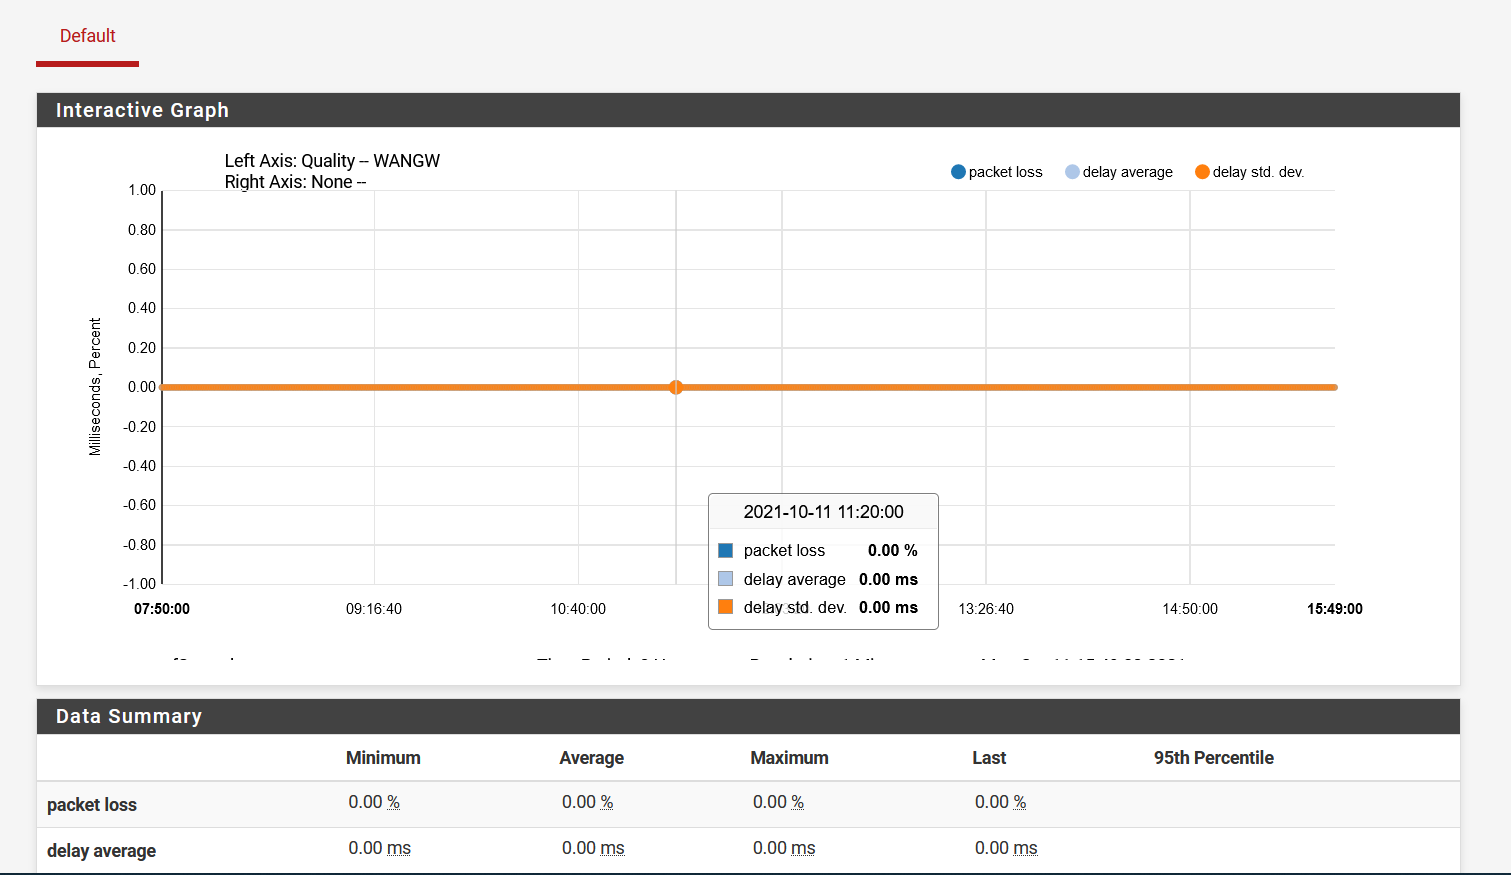
Well, it's the same thing after resetting:
-
Have a look at the rrd file :
ls -alrt /var/db/rrd/This command will revers list, with details, all the rrd files.
Are the time stamps all very recent ?
Like :
.... -rw-r--r-- 1 nobody wheel 393168 Oct 11 10:30 ipsec-traffic.rrd -rw-r--r-- 1 nobody wheel 393168 Oct 11 10:30 ipsec-packets.rrd -rw-r--r-- 1 nobody wheel 393168 Oct 11 10:30 ovpns1-traffic.rrd -rw-r--r-- 1 nobody wheel 393168 Oct 11 10:30 ovpns1-packets.rrd -rw-r--r-- 1 nobody wheel 49720 Oct 11 10:30 ovpns1-vpnusers.rrd -rw-r--r-- 1 nobody wheel 245976 Oct 11 10:30 system-states.rrd -rw-r--r-- 1 nobody wheel 245976 Oct 11 10:30 system-processor.rrd -rw-r--r-- 1 nobody wheel 735320 Oct 11 10:30 system-memory.rrd -rw-r--r-- 1 nobody wheel 588592 Oct 11 10:30 system-mbuf.rrd -rw-r--r-- 1 nobody wheel 197752 Oct 11 10:30 captiveportal-cpzone1-concurrent.rrd -rw-r--r-- 1 nobody wheel 197752 Oct 11 10:30 captiveportal-cpzone1-loggedin.rrd -rw-r--r-- 1 nobody wheel 882048 Oct 11 10:30 ntpd.rrd -rw-r--r-- 1 nobody wheel 441864 Oct 11 10:30 lan-dhcpd.rrd -rw-r--r-- 1 nobody wheel 441864 Oct 11 10:30 opt1-dhcpd.rrd -rw-r--r-- 1 nobody wheel 71216 Oct 11 10:30 AP1-quality.rrd -rw-r--r-- 1 nobody wheel 71216 Oct 11 10:30 AP2-quality.rrd -rw-r--r-- 1 nobody wheel 147848 Oct 11 10:30 AP3-quality.rrd -rw-r--r-- 1 nobody wheel 147848 Oct 11 10:30 HE_TUN_TUNNELV6-quality.rrd -rw-r--r-- 1 nobody wheel 147848 Oct 11 10:30 OPENVPN_VPNV4-quality.rrd -rw-r--r-- 1 nobody wheel 147848 Oct 11 10:30 OPENVPN_VPNV6-quality.rrd -rw-r--r-- 1 nobody wheel 147848 Oct 11 10:30 WAN_DHCP-quality.rrd -
@gertjan said in Status -> Monitoring shows no activity:
ls -alrt /var/db/rrd/
Yes, I see very recent files:
[2.5.2-RELEASE][root@pfSense.home.arpa]/root: ls -alrt /var/db/rrd/ total 13700 drwxr-xr-x 2 nobody wheel 1536 Oct 11 03:25 . -rw-r--r-- 1 root wheel 15895 Oct 11 11:50 updaterrd.sh -rw-r--r-- 1 nobody wheel 441864 Oct 12 16:53 opt2-dhcpd.rrd -rw-r--r-- 1 nobody wheel 441864 Oct 12 17:54 opt3-dhcpd.rrd drwxr-xr-x 6 root wheel 512 Oct 12 18:50 .. -rw-r--r-- 1 nobody wheel 441864 Oct 12 18:55 opt4-dhcpd.rrd -rw-r--r-- 1 nobody wheel 441864 Oct 12 19:56 opt5-dhcpd.rrd -rw-r--r-- 1 nobody wheel 147848 Oct 12 19:56 OPENVPN_RA_VPNV4-quality.rrd -rw-r--r-- 1 nobody wheel 147848 Oct 12 19:56 WANGW-quality.rrd -rw-r--r-- 1 nobody wheel 147848 Oct 12 19:56 WIREGUARD_S2S_WGV4-quality.rrd -rw-r--r-- 1 nobody wheel 393168 Oct 12 19:57 wan-traffic.rrd -rw-r--r-- 1 nobody wheel 393168 Oct 12 19:57 wan-packets.rrd -rw-r--r-- 1 nobody wheel 393168 Oct 12 19:57 opt2-traffic.rrd -rw-r--r-- 1 nobody wheel 393168 Oct 12 19:57 opt2-packets.rrd -rw-r--r-- 1 nobody wheel 393168 Oct 12 19:57 opt3-traffic.rrd -rw-r--r-- 1 nobody wheel 393168 Oct 12 19:57 opt3-packets.rrd -rw-r--r-- 1 nobody wheel 393168 Oct 12 19:57 opt4-traffic.rrd -rw-r--r-- 1 nobody wheel 393168 Oct 12 19:57 opt4-packets.rrd -rw-r--r-- 1 nobody wheel 393168 Oct 12 19:57 opt5-traffic.rrd -rw-r--r-- 1 nobody wheel 393168 Oct 12 19:57 opt5-packets.rrd -rw-r--r-- 1 nobody wheel 393168 Oct 12 19:57 opt6-traffic.rrd -rw-r--r-- 1 nobody wheel 393168 Oct 12 19:57 opt6-packets.rrd -rw-r--r-- 1 nobody wheel 393168 Oct 12 19:57 opt8-traffic.rrd -rw-r--r-- 1 nobody wheel 393168 Oct 12 19:57 opt8-packets.rrd -rw-r--r-- 1 nobody wheel 393168 Oct 12 19:57 opt9-traffic.rrd -rw-r--r-- 1 nobody wheel 393168 Oct 12 19:57 opt9-packets.rrd -rw-r--r-- 1 nobody wheel 393168 Oct 12 19:57 ipsec-traffic.rrd -rw-r--r-- 1 nobody wheel 393168 Oct 12 19:57 ipsec-packets.rrd -rw-r--r-- 1 nobody wheel 393168 Oct 12 19:57 ovpns2-traffic.rrd -rw-r--r-- 1 nobody wheel 393168 Oct 12 19:57 ovpns2-packets.rrd -rw-r--r-- 1 nobody wheel 49720 Oct 12 19:57 ovpns2-vpnusers.rrd -rw-r--r-- 1 nobody wheel 393168 Oct 12 19:57 ovpns1-traffic.rrd -rw-r--r-- 1 nobody wheel 393168 Oct 12 19:57 ovpns1-packets.rrd -rw-r--r-- 1 nobody wheel 49720 Oct 12 19:57 ovpns1-vpnusers.rrd -rw-r--r-- 1 nobody wheel 245976 Oct 12 19:57 system-states.rrd -rw-r--r-- 1 nobody wheel 245976 Oct 12 19:57 system-processor.rrd -rw-r--r-- 1 nobody wheel 735320 Oct 12 19:57 system-memory.rrd -rw-r--r-- 1 nobody wheel 588592 Oct 12 19:57 system-mbuf.rrd -rw-r--r-- 1 nobody wheel 882048 Oct 12 19:57 ntpd.rrd -
I assume you see no data for the OpenVPN gateway either?
-
@stephenw10 said in Status -> Monitoring shows no activity:
I assume you see no data for the OpenVPN gateway either?
Correct.
-
Correct time and date on the box? I've seen some odd things happen there when it tries to display data from the wrong time etc. I haven't seen anything like that in 2.5.2 though.
-
@stephenw10 said in Status -> Monitoring shows no activity:
Correct time and date on the box? I've seen some odd things happen there when it tries to display data from the wrong time etc. I haven't seen anything like that in 2.5.2 though.
Yes, time and date synced with NTP servers. I haven't seen any time issues with this box when I'm checking logs. They seem to be on point.
-
Hmm, must be something different. Any errors logged when you open the graphs?
-
@stephenw10 said in Status -> Monitoring shows no activity:
Hmm, must be something different. Any errors logged when you open the graphs?
This is all I see under System Logs -> System -> GUI Service when I open monitoring:
Oct 13 10:37:41 nginx 192.168.20.251 - - [13/Oct/2021:10:37:41 +0800] "POST /rrd_fetch_json.php HTTP/2.0" 200 5401 "https://192.168.10.1/status_monitoring.php" "Mozilla/5.0 (Windows NT 10.0; Win64; x64; rv:93.0) Gecko/20100101 Firefox/93.0" Oct 13 10:37:40 nginx 192.168.20.251 - - [13/Oct/2021:10:37:40 +0800] "GET /status_monitoring.php HTTP/2.0" 200 15458 "https://192.168.10.1/status_monitoring.php" "Mozilla/5.0 (Windows NT 10.0; Win64; x64; rv:93.0) Gecko/20100101 Firefox/93.0" -
Same from different browsers? Different clients?
What's the history of that box? Has is ever seen any other issues?
I'd be tempted to re-install it and restore it at this point if that's something that's practical for that location. If only to be sure that corrects it and prove it's not a config issue.
Steve
-
@stephenw10 said in Status -> Monitoring shows no activity:
Same from different browsers? Different clients?
What's the history of that box? Has is ever seen any other issues?
I'd be tempted to re-install it and restore it at this point if that's something that's practical for that location. If only to be sure that corrects it and prove it's not a config issue.
Steve
Yes, and yes. Even on mobile phones.
No, this did not encounter any issues yet. This is the first time. And everything seems to be working just fine except this. Well, there's one issue for some clients when accessing the weGUI and I forgot the cause but it's only happening on FireFox for some clients:
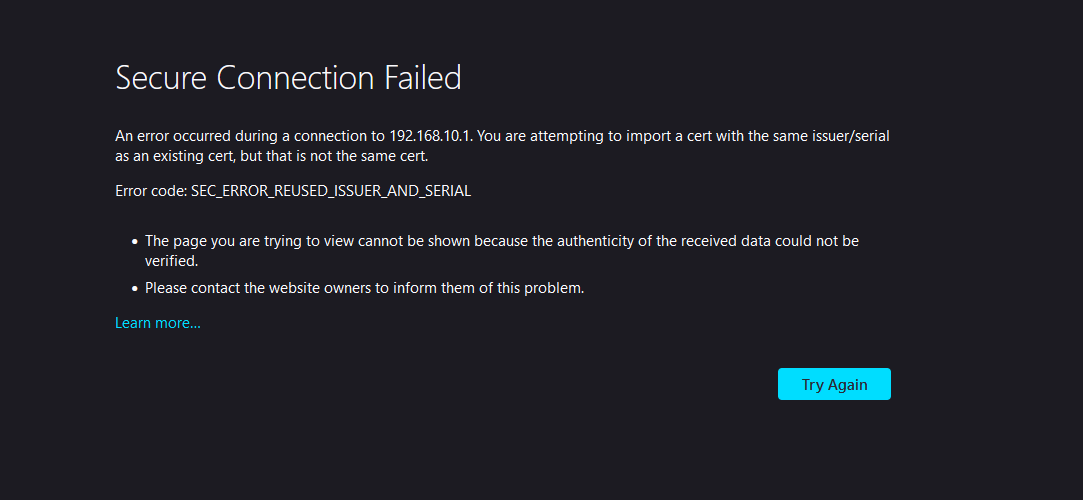
Not sure if it's related to the traffic monitoring issue though. The affected box is remote from me, so it's not something that I can do immediately. Reinstalling would be my last resort though unless there's no more troubleshooting steps that I can do?