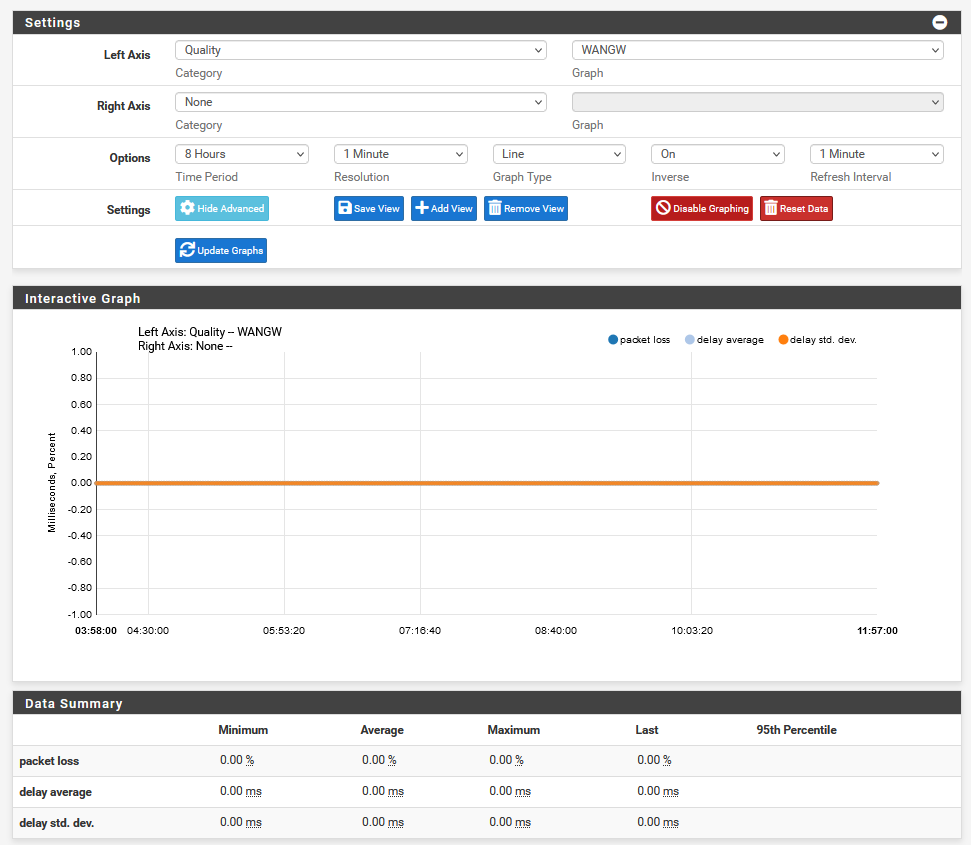
Status -> Monitoring shows no activity
-
Have a look at the rrd file :
ls -alrt /var/db/rrd/This command will revers list, with details, all the rrd files.
Are the time stamps all very recent ?
Like :
.... -rw-r--r-- 1 nobody wheel 393168 Oct 11 10:30 ipsec-traffic.rrd -rw-r--r-- 1 nobody wheel 393168 Oct 11 10:30 ipsec-packets.rrd -rw-r--r-- 1 nobody wheel 393168 Oct 11 10:30 ovpns1-traffic.rrd -rw-r--r-- 1 nobody wheel 393168 Oct 11 10:30 ovpns1-packets.rrd -rw-r--r-- 1 nobody wheel 49720 Oct 11 10:30 ovpns1-vpnusers.rrd -rw-r--r-- 1 nobody wheel 245976 Oct 11 10:30 system-states.rrd -rw-r--r-- 1 nobody wheel 245976 Oct 11 10:30 system-processor.rrd -rw-r--r-- 1 nobody wheel 735320 Oct 11 10:30 system-memory.rrd -rw-r--r-- 1 nobody wheel 588592 Oct 11 10:30 system-mbuf.rrd -rw-r--r-- 1 nobody wheel 197752 Oct 11 10:30 captiveportal-cpzone1-concurrent.rrd -rw-r--r-- 1 nobody wheel 197752 Oct 11 10:30 captiveportal-cpzone1-loggedin.rrd -rw-r--r-- 1 nobody wheel 882048 Oct 11 10:30 ntpd.rrd -rw-r--r-- 1 nobody wheel 441864 Oct 11 10:30 lan-dhcpd.rrd -rw-r--r-- 1 nobody wheel 441864 Oct 11 10:30 opt1-dhcpd.rrd -rw-r--r-- 1 nobody wheel 71216 Oct 11 10:30 AP1-quality.rrd -rw-r--r-- 1 nobody wheel 71216 Oct 11 10:30 AP2-quality.rrd -rw-r--r-- 1 nobody wheel 147848 Oct 11 10:30 AP3-quality.rrd -rw-r--r-- 1 nobody wheel 147848 Oct 11 10:30 HE_TUN_TUNNELV6-quality.rrd -rw-r--r-- 1 nobody wheel 147848 Oct 11 10:30 OPENVPN_VPNV4-quality.rrd -rw-r--r-- 1 nobody wheel 147848 Oct 11 10:30 OPENVPN_VPNV6-quality.rrd -rw-r--r-- 1 nobody wheel 147848 Oct 11 10:30 WAN_DHCP-quality.rrd -
@gertjan said in Status -> Monitoring shows no activity:
ls -alrt /var/db/rrd/
Yes, I see very recent files:
[2.5.2-RELEASE][root@pfSense.home.arpa]/root: ls -alrt /var/db/rrd/ total 13700 drwxr-xr-x 2 nobody wheel 1536 Oct 11 03:25 . -rw-r--r-- 1 root wheel 15895 Oct 11 11:50 updaterrd.sh -rw-r--r-- 1 nobody wheel 441864 Oct 12 16:53 opt2-dhcpd.rrd -rw-r--r-- 1 nobody wheel 441864 Oct 12 17:54 opt3-dhcpd.rrd drwxr-xr-x 6 root wheel 512 Oct 12 18:50 .. -rw-r--r-- 1 nobody wheel 441864 Oct 12 18:55 opt4-dhcpd.rrd -rw-r--r-- 1 nobody wheel 441864 Oct 12 19:56 opt5-dhcpd.rrd -rw-r--r-- 1 nobody wheel 147848 Oct 12 19:56 OPENVPN_RA_VPNV4-quality.rrd -rw-r--r-- 1 nobody wheel 147848 Oct 12 19:56 WANGW-quality.rrd -rw-r--r-- 1 nobody wheel 147848 Oct 12 19:56 WIREGUARD_S2S_WGV4-quality.rrd -rw-r--r-- 1 nobody wheel 393168 Oct 12 19:57 wan-traffic.rrd -rw-r--r-- 1 nobody wheel 393168 Oct 12 19:57 wan-packets.rrd -rw-r--r-- 1 nobody wheel 393168 Oct 12 19:57 opt2-traffic.rrd -rw-r--r-- 1 nobody wheel 393168 Oct 12 19:57 opt2-packets.rrd -rw-r--r-- 1 nobody wheel 393168 Oct 12 19:57 opt3-traffic.rrd -rw-r--r-- 1 nobody wheel 393168 Oct 12 19:57 opt3-packets.rrd -rw-r--r-- 1 nobody wheel 393168 Oct 12 19:57 opt4-traffic.rrd -rw-r--r-- 1 nobody wheel 393168 Oct 12 19:57 opt4-packets.rrd -rw-r--r-- 1 nobody wheel 393168 Oct 12 19:57 opt5-traffic.rrd -rw-r--r-- 1 nobody wheel 393168 Oct 12 19:57 opt5-packets.rrd -rw-r--r-- 1 nobody wheel 393168 Oct 12 19:57 opt6-traffic.rrd -rw-r--r-- 1 nobody wheel 393168 Oct 12 19:57 opt6-packets.rrd -rw-r--r-- 1 nobody wheel 393168 Oct 12 19:57 opt8-traffic.rrd -rw-r--r-- 1 nobody wheel 393168 Oct 12 19:57 opt8-packets.rrd -rw-r--r-- 1 nobody wheel 393168 Oct 12 19:57 opt9-traffic.rrd -rw-r--r-- 1 nobody wheel 393168 Oct 12 19:57 opt9-packets.rrd -rw-r--r-- 1 nobody wheel 393168 Oct 12 19:57 ipsec-traffic.rrd -rw-r--r-- 1 nobody wheel 393168 Oct 12 19:57 ipsec-packets.rrd -rw-r--r-- 1 nobody wheel 393168 Oct 12 19:57 ovpns2-traffic.rrd -rw-r--r-- 1 nobody wheel 393168 Oct 12 19:57 ovpns2-packets.rrd -rw-r--r-- 1 nobody wheel 49720 Oct 12 19:57 ovpns2-vpnusers.rrd -rw-r--r-- 1 nobody wheel 393168 Oct 12 19:57 ovpns1-traffic.rrd -rw-r--r-- 1 nobody wheel 393168 Oct 12 19:57 ovpns1-packets.rrd -rw-r--r-- 1 nobody wheel 49720 Oct 12 19:57 ovpns1-vpnusers.rrd -rw-r--r-- 1 nobody wheel 245976 Oct 12 19:57 system-states.rrd -rw-r--r-- 1 nobody wheel 245976 Oct 12 19:57 system-processor.rrd -rw-r--r-- 1 nobody wheel 735320 Oct 12 19:57 system-memory.rrd -rw-r--r-- 1 nobody wheel 588592 Oct 12 19:57 system-mbuf.rrd -rw-r--r-- 1 nobody wheel 882048 Oct 12 19:57 ntpd.rrd -
I assume you see no data for the OpenVPN gateway either?
-
@stephenw10 said in Status -> Monitoring shows no activity:
I assume you see no data for the OpenVPN gateway either?
Correct.
-
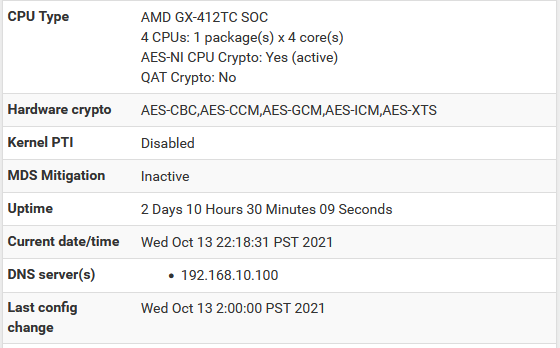
Correct time and date on the box? I've seen some odd things happen there when it tries to display data from the wrong time etc. I haven't seen anything like that in 2.5.2 though.
-
@stephenw10 said in Status -> Monitoring shows no activity:
Correct time and date on the box? I've seen some odd things happen there when it tries to display data from the wrong time etc. I haven't seen anything like that in 2.5.2 though.
Yes, time and date synced with NTP servers. I haven't seen any time issues with this box when I'm checking logs. They seem to be on point.
-
Hmm, must be something different. Any errors logged when you open the graphs?
-
@stephenw10 said in Status -> Monitoring shows no activity:
Hmm, must be something different. Any errors logged when you open the graphs?
This is all I see under System Logs -> System -> GUI Service when I open monitoring:
Oct 13 10:37:41 nginx 192.168.20.251 - - [13/Oct/2021:10:37:41 +0800] "POST /rrd_fetch_json.php HTTP/2.0" 200 5401 "https://192.168.10.1/status_monitoring.php" "Mozilla/5.0 (Windows NT 10.0; Win64; x64; rv:93.0) Gecko/20100101 Firefox/93.0" Oct 13 10:37:40 nginx 192.168.20.251 - - [13/Oct/2021:10:37:40 +0800] "GET /status_monitoring.php HTTP/2.0" 200 15458 "https://192.168.10.1/status_monitoring.php" "Mozilla/5.0 (Windows NT 10.0; Win64; x64; rv:93.0) Gecko/20100101 Firefox/93.0" -
Same from different browsers? Different clients?
What's the history of that box? Has is ever seen any other issues?
I'd be tempted to re-install it and restore it at this point if that's something that's practical for that location. If only to be sure that corrects it and prove it's not a config issue.
Steve
-
@stephenw10 said in Status -> Monitoring shows no activity:
Same from different browsers? Different clients?
What's the history of that box? Has is ever seen any other issues?
I'd be tempted to re-install it and restore it at this point if that's something that's practical for that location. If only to be sure that corrects it and prove it's not a config issue.
Steve
Yes, and yes. Even on mobile phones.
No, this did not encounter any issues yet. This is the first time. And everything seems to be working just fine except this. Well, there's one issue for some clients when accessing the weGUI and I forgot the cause but it's only happening on FireFox for some clients:
Not sure if it's related to the traffic monitoring issue though. The affected box is remote from me, so it's not something that I can do immediately. Reinstalling would be my last resort though unless there's no more troubleshooting steps that I can do?
-
Well it's not something I've come across before so further investigation without direct access becomes difficult. At least beyond what we've already tried.
I agree that cert error is probably unrelated and would not affect other browsers for the graphs specifically. The other RRD graphs are being populated I assume, only the gateway quality data that is failing?Steve
-
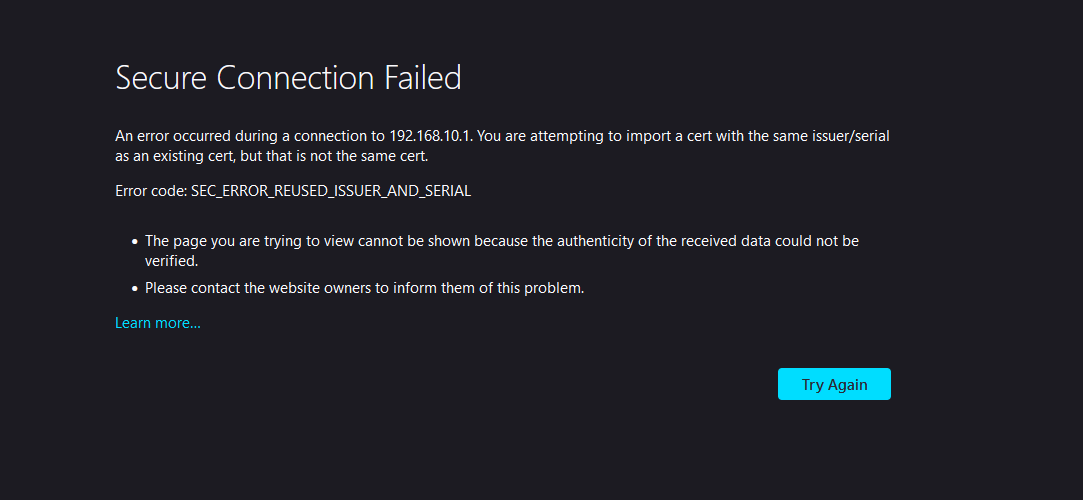
About the Firefox message.
Look here.
Firefox's help page makes me ask : what is your pfSense version ?The message makes me thing that the brwoser that shows that message knows about the pfSense cert exception ... but the cert cahnged on the pfSense side.
You could do what the message proposes :
Use the console or SSH - read Docs » pfSense software » Configuration » Advanced Configuration Options
and re generate a new cert.Are you sure the pfsense system clock is ok ??
-
@stephenw10 said in Status -> Monitoring shows no activity:
Well it's not something I've come across before so further investigation without direct access becomes difficult. At least beyond what we've already tried.
I agree that cert error is probably unrelated and would not affect other browsers for the graphs specifically. The other RRD graphs are being populated I assume, only the gateway quality data that is failing?Steve
No, it affects all other RRD graphs. I just checked.
@gertjan said in Status -> Monitoring shows no activity:
About the Firefox message.
Look here.
Firefox's help page makes me ask : what is your pfSense version ?The message makes me thing that the brwoser that shows that message knows about the pfSense cert exception ... but the cert cahnged on the pfSense side.
You could do what the message proposes :
Use the console or SSH - read Docs » pfSense software » Configuration » Advanced Configuration Options
and re generate a new cert.Are you sure the pfsense system clock is ok ??
Ahh, yeah. I now remember that this was caused by me renewing the cert at one point. I also remember doing that workaround in one of my clients to solve the issue but it was always isolated to FireFox.
The pfsense version is the latest 2.5.2.
I'll make sure to renew that self-signed cert and see if that issue goes away.
See for yourself about the time:

-
@kevindd992002 said in Status -> Monitoring shows no activity:
and see if that issue goes away.
On that specific Firefox install : don't wait forever.
Delete the exception you made for the pfSense cert on that Firefox device.
Access pfSense again, create a new exception, and you'll be fine. -
@gertjan said in Status -> Monitoring shows no activity:
@kevindd992002 said in Status -> Monitoring shows no activity:
and see if that issue goes away.
On that specific Firefox install : don't wait forever.
Delete the exception you made for the pfSense cert on that Firefox device.
Access pfSense again, create a new exception, and you'll be fine.Yup, it's all done.
-
So there is no RRD data shown at all, for any time period?
That makes it look more like it's unable to read the files but I'd expect to see errors logged if that were the case. Possibly there was data and graphs for longer periods before you reset the RRD files?
Can you restore the config into something local to test that?Otherwise you could try force installing the rrdtool pkg. Iy's possible something was damaged there though it appears to be writing them correctly still.
Steve
-
@stephenw10 said in Status -> Monitoring shows no activity:
So there is no RRD data shown at all, for any time period?
That makes it look more like it's unable to read the files but I'd expect to see errors logged if that were the case. Possibly there was data and graphs for longer periods before you reset the RRD files?
Can you restore the config into something local to test that?Otherwise you could try force installing the rrdtool pkg. Iy's possible something was damaged there though it appears to be writing them correctly still.
Steve
Before the RRD data reset:
- data is available in Status -> RRD Summary
- quality monitoring data/graph is available for past gateways
- no other monitoring data/graphs available; flat line and no values
Sure, I can do that tomorrow to a pfsense VM and see what happens. If I restore a config on a brand new install of pfsense on a VM, how does it know how to map the config interfaces to the virtual interfaces of the VM?
When I take the a backup of the config, do I include RRD data?
What is the command again to force install a pkg in pfsense? I know apt in Debian but don't have experience in FreeBSD.
The only non-official thing I've done with this pfsense install was to install the WireGuard package (by Christian) when it was not yet available in the package repository.
-
It would be:
pkg install -f rrdtool -
Before re installing : here is something to do :
Together with the rrd files in /var/db/rrd/ you'll find a file called "updaterrd.sh".
The content is pretty straight forward, this is the file that collects the stats, and add them to the rrd files.No need to edit this file, as it gets regenerated when an interface gets added, removed, or a gateway gets added etc.
Use the forum search button, and look for "updaterrd.sh" : you'll find more posts with "no monitoring stats".
Check the date and time of the updaterrd.sh file.
Change some settings on an interface or gateway.
Check that the file was updated. -
@gertjan said in Status -> Monitoring shows no activity:
updaterrd.sh
Before changing some settings on a gateway:

After changing some settings on an interface:

So yeah, it looks like it did change as expected. However, when I tried changing the monitor IP of my WAN gateway earlier, the file was not updated. What does that tell us?