I have no idea whos causing this traffic....
-
@Gertjan said in I have no idea whos causing this traffic....:
Second approach :
Even more easier : disconnect physically all LAN devices,While that can work sure - I wouldn't call it easier ;) Seems like a lot of work to me - compared to just simple sniff.. hehehe Unless your goal is to get up out of your chair.. Which could be good thing ;)
All valid methods of how to skin this specific cat ;)
Other methods, firewall rule is option I didn't think of actually.. would show you where the traffic is going as well which could be insightful in figuring out what exactly the traffic is.
-
@johnpoz said in I have no idea whos causing this traffic....:
All valid methods of how to skin this specific cat ;)
CAT 6?

-
@Cool_Corona , Decoy network?
-
-
@Cool_Corona said in I have no idea whos causing this traffic....:
Any ideas?
L3 switch + mirror port and / or SPAN protocol is your good friend, if you want to get a detailed picture
-
While sure he could view the traffic via a span port.. There really is no need, just diagnostic menu packet capture will allow him to do a sniff and see the traffic flow through pfsense to figure out what IP is involved and where it going.
-
@johnpoz said in I have no idea whos causing this traffic....:
just diagnostic menu packet capture
Sorry, I was thinking about Wireshark (it was missed), plus what was described above.
Personally, I like it better as packet capture in pfsense tool+++edit:
much more configurable and detailedCats bury it so they can't see it!
(You know what I mean if you have a cat) -
You understand you can just download whatever the packet capture captures into wireshark right? Just click the download button ;) And then open it up with wireshark or whatever your fav tool is..
A pcap is a pcap ;) While true the gui interface doesn't really show you a lot of detail on the capture. but if all he is really interested is the IP causing the traffic and what port its talking to - the gui would provide that info for sure. You can also always up the level displayed - but yeah I pretty much always download the pcap into wireshark when want to analyze some sniff.
-
@johnpoz said in I have no idea whos causing this traffic....:
You understand you can just download whatever the packet capture captures into wireshark right?
I agree with you, I may just be used to clicking the Wireshark icon and the SPAN VLAN is connected anyway.
I handle multiple things on multiple networks and it’s that simple..if don't need deep investigation the pfSense GUI is enough
-
@DaddyGo said in I have no idea whos causing this traffic....:
Sorry, I was thinking about Wireshark (it was missed), plus what was described above.
Personally, I like it better as packet capture in pfsense toolI mentioned Packet Capture. I also prefer Wireshark, but it won't run on pfsense, so either you run it on a computer that can see the traffic or use Packet Capture and download to Wireshark. If you have a managed switch, you can set up port mirroring to watch the desired connection, at least on the LAN side.
PfSense running on Qotom mini PC
i5 CPU, 4 GB memory, 32 GB SSD & 4 Intel 1 Gb Ethernet ports.
UniFi AC-Lite access pointI haven't lost my mind. It's around here...somewhere...
-
It's also possible to do remote capture.
Wireshark connects to pfSense over SSH in that case. -
I used to do that, when I had a Linux firewall. However, it's not possible to run it on pfsense, IIRC.
PfSense running on Qotom mini PC
i5 CPU, 4 GB memory, 32 GB SSD & 4 Intel 1 Gb Ethernet ports.
UniFi AC-Lite access pointI haven't lost my mind. It's around here...somewhere...
-
@JKnott said in I have no idea whos causing this traffic....:
I also prefer Wireshark, but it won't run on pfsense, so either you run it on a computer that can see the traffic or use Packet Capture
I agree with you too
so I wrote the L3 switch (above) + mirror port
(even on a smaller network, it’s worth just keeping one in your desktop drawer for testing)we use SPAN VLAN on the Cisco network and we are testing here with Wireshark
(I got used to it and simple method)I don't like TP-Link, but for a mobile test device it fits a lot (we use it :-)) TL-SG105E, it knows the port mirroring and thats all
Cats bury it so they can't see it!
(You know what I mean if you have a cat) -
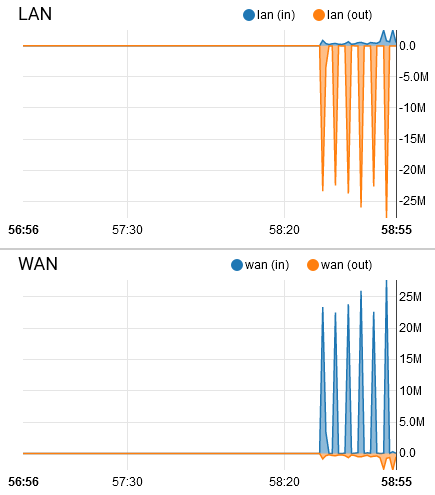
My bet is someone streaming off plex ;) or something similar - there is another thread about graphs showing double - and the @Cool_Corona posted image looks exactly like how plex can stream data to a client..
Here is mine that I just used for image in that other thread.
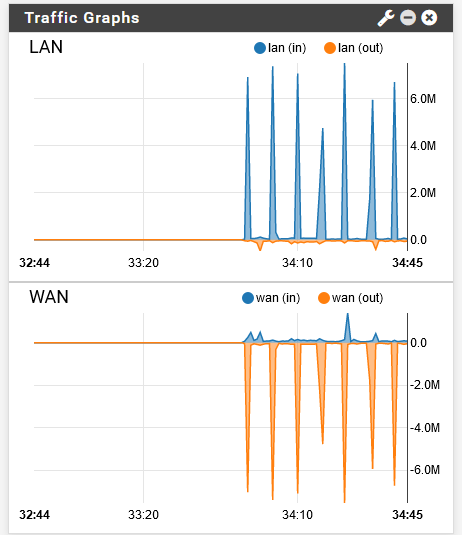
While someone streaming off my plex, lower data rates is all - he prob has higher bitrate movies on his ;)
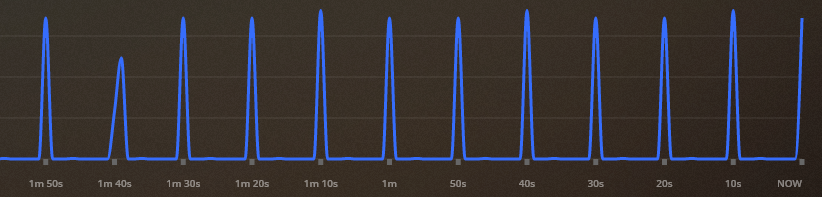
Here is plex showing the data
-
@DaddyGo said in I have no idea whos causing this traffic....:
(even on a smaller network, it’s worth just keeping one in your desktop drawer for testing)
See my post Creating a "data tap". I also use a TP-Link TL-SG105E switch. I carry it in my computer bag and have also used it as a plain switch on occasion. Since I use a port based VLAN on it, instead of tags, it works fine.
-
@JKnott said in I have no idea whos causing this traffic....:
I also use a TP-Link TL-SG105E switch
Well, then we think on the same way
-
One crude option is watching the traffic graph live (Status -> Traffic Graph) and changing the interface to LAN. Depending on your network design, if you're not seeing any data, you may also have to change the filer to "Remote".
Another option is to install the ntopng package. In the ntopng settings menu, make sure that all of your LAN interfaces are tagged. Once in the ntopng webgui, click on the "Flows" menu across the top and you will see details (protocol, source, destination, throughput, etc) about each connection. From there I would sort by the "Actual Thpt" column so the connections generating the most bandwidth are at the top of the list.
Yet another option is installing the softflowd package and pointing it at a netflow collector like PRTG.
I would use ntopng. You should be able to find the offending device in a few min.
-
I think I saw similar forum thread from Belgian op not long ago. I am not sure if he already found the solution.
Wireshark is a great tool but if I may suggest, use QRadar CE (FREE) to analyze your live Pfsense logs.


Like today, I found a lot offensive IP addresses.
-
@AKEGEC said in I have no idea whos causing this traffic....:
QRadar CE
Thanks for the mention - I found something to play with this weekend ;)
But a SIEM is completely different animal than protocol analyzer like wireshark ;)
Normally your SIEM doesn't even accept flows, so you can't really see say your top talkers or who is talking to who, unless you logging allowed rules, etc.. And just seeing something was allowed doesn't show you how much data they are moving, etc.
But it does look interesting - so think will fire up the CE.. 50 events a second should be pretty reasonable.. for what your home setup would see.
-
You can do remote tcpdump on pfSense , and ssh tunnel it to wireshark , using these steps.
Assumptions:
-----------------
pfSense vers : 2.4.5-p1
Username on both linux & pfSense : pfuser
Firewall hostname : pf-fw-01
Interface to sniff on : igb1.100
Install / Prepare Steps: ------------------------------ As admin on pfSense install pkg install security/sudo As admin on pfSense (syyshhh) ------------------------------- 1: visudo , add : %admins ALL=(ALL) NOPASSWD: ALL 2: vi /etc/groups , make sure your user is member of admins.As root on local linux (Wireshark display machine) --------------------------------------------------- 3: ssh-keygen 4: ssh-copy-id pfuser@pf-fw-01Use wireshark as frontend for pfSense tcpdump ... aka. Start a sniff ---------------------------------------------------------------------- As root on local linux machine (to begin wireshark "remote" snif and tunnel data via ssh) - 'not port 22' (don't match ssh, used for tunneling data) ssh pfuser@pf-fw-01 sudo tcpdump -iigb1.100 -U -s0 -w - 'not port 22' | wireshark -k -i -These are some notes I took like 2 years back , on 2.4-RC
I'm not sure if the "ssh keygen" steps (3-4) in the linux machine, makes sense to do as root. I might have done that as pfuser
But i just tried a remote wireshark , and it still works in 2.4.5-p1
if-name had to be changed from -iigb1_vlan100 to -iigb1.100Edit:
Watch out .. This will load your ssh connection hard
Don't sniff a loaded 1Gb if , via a remote 20Mb ssh
Use a pfSense local pcap dump instead , or make a more specific tcp dump match on the pfSense
/Bingo