NTP - poor reach after 20 hours
-
@johnpoz pfsense has been up for two weeks, but changed NTP to four pool servers from five individual servers from this NTP server list yesterday. I'll wait a few more days to see how it settles in.
-
You prob don't need more than 1 pool ;)
Yeah I am keeping an eye mind as well, since this is a clean install.. I am not sure if anything changed with the ntp client in this update, etc.
Will follow back in this in a few days.. I am seeing the same thing where reach is just not constant 377.. But also seeing the steps happening the log.. Which will refresh the reach count, etc.
example:
Apr 15 10:46:10 	ntpd 	42851 	0.0.0.0 0615 05 clock_sync
Apr 15 10:46:09 	ntpd 	42851 	0.0.0.0 061c 0c clock_step +0.475341 s
And offset is horrible currently..
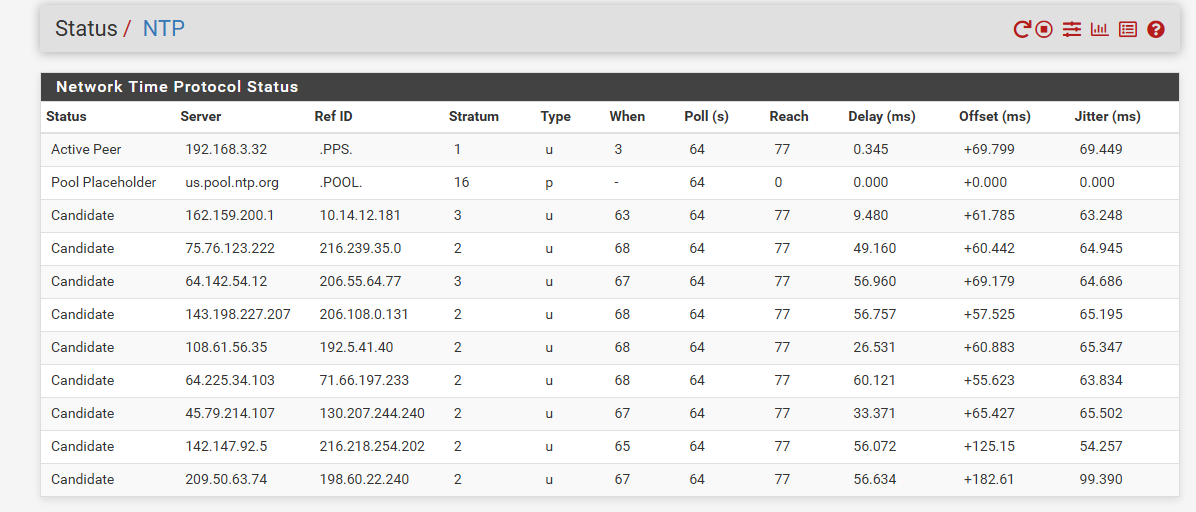
Prob doesn't help that I just also updated and rebooted my local ntp server ;) But yeah ntp can take a while to setting down..
-
@johnpoz said in NTP - poor reach after 20 hours:
You prob don't need more than 1 pool ;)
shoud I go ahead and delete the other 3 pools that I have and just use 0.us.pool.ntp.org?
-
Well you should prob use the pfsense pool ;)
The ntp pool allows for vendors to get their own pool names.. And users using pools using the vendors devices should use them... I haven't gotten around to changing mine - doing it now ;)
0.pfsense.pool.ntp.org
for example..
Just changed mine

here is info on the vendor pools
https://www.pool.ntp.org/en/vendors.html -
This is my linux server
And i haven't even sync'ed it up to my Tbolt or Samsung or ....
Just using inet peers./Bingo
ntpq -p remote refid st t when poll reach delay offset jitter ============================================================================== -n1.taur.dk .PPS. 1 u 501 1024 377 7.190 0.022 0.841 +80.71.132.103 ( .GPS. 1 u 868 1024 377 1.821 0.268 0.135 *mmo2.ntp.se .PPS. 1 u 971 1024 377 1.972 0.206 0.078 +78.156.103.10 217.198.219.102 2 u 77 1024 377 7.466 0.240 0.247 +mail.roostervan 212.99.225.86 2 u 16 1024 377 2.453 0.278 0.100 -time.cloudflare 10.20.10.78 3 u 1008 1024 377 10.140 0.042 0.113 -
^ yeah this a normal sort of status you should be seeing.
edit: That is some really low delays.. nice!
-
My pfSense
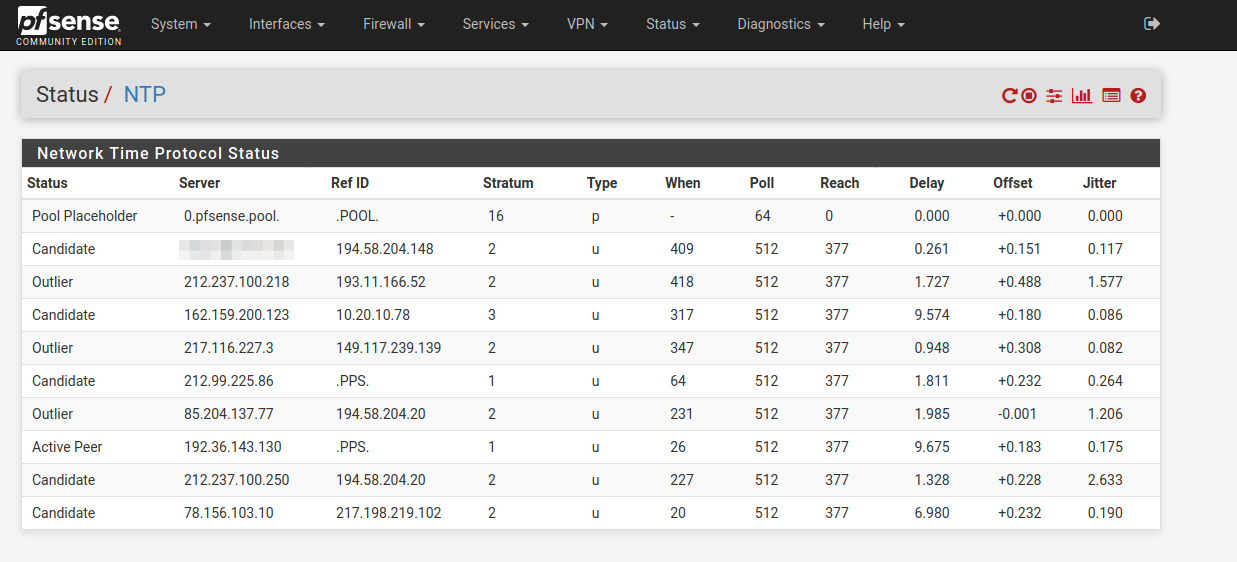
I use pfSense pool for pfSense.
But selected servers for my Linux.
n1.taur.dk is a friend of mine (also a time-nut) , his server is always "spot on"
My linux usually switches between n1.taur & the swedish one./Bingo
-
yeah those are some really nice low delays - have a nice internet connection ;)
-
@johnpoz
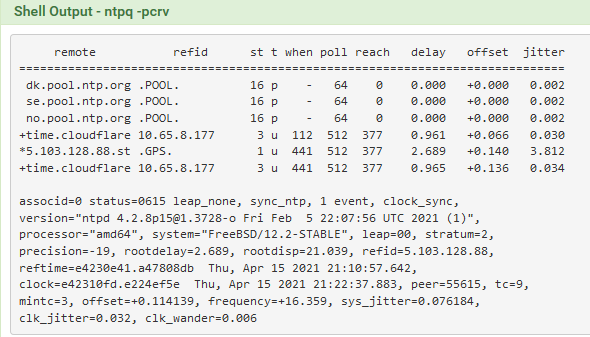
switched over to pfsense.pool 90 min. ago. Here is status so far:[2.5.0-RELEASE][admin@pfsense.home]/var/log: ntpq -p remote refid st t when poll reach delay offset jitter ============================================================================== 0.pfsense.pool. .POOL. 16 p - 64 0 0.000 +0.000 0.000 time.nullrouten 132.163.97.1 2 u 713 256 344 62.225 +0.955 0.504 +tick.nde.unlv.e 98.150.140.243 2 u 390 128 204 71.450 -7.756 2.534 +165.227.106.11 200.98.196.212 2 u 673 128 240 40.571 -0.168 3.267 *vps1.n1.ca 216.218.192.202 2 u 981 128 200 69.463 +1.543 2.424 -
-
There's quite a bit of jitter on your selected peer.
It' only won because it's a Stratum 1./Bingo
-
@bingo600 subject of thread is 'poor' reach not 'porn' reach.
-
@johnpoz
i updated from 2.5.0 to 2.5.1. Here is NTP status after 90 minutes after reboot. Hopefully the Scandinavian guys won't try and shame me again with their impressive NTP output.[2.5.1-RELEASE][admin@pfsense.home]/var/log: ntpq -pcrv remote refid st t when poll reach delay offset jitter ============================================================================== 0.pfsense.pool. .POOL. 16 p - 64 0 0.000 +0.000 0.000 +unifi.versadns. 71.66.197.233 2 u 632 128 120 42.354 -2.973 1.580 *clock.nyc.he.ne .CDMA. 1 u 453 128 144 37.191 +1.439 1.048 associd=0 status=0618 leap_none, sync_ntp, 1 event, no_sys_peer, version="ntpd 4.2.8p15@1.3728-o Fri Feb 5 22:07:56 UTC 2021 (1)", processor="amd64", system="FreeBSD/12.2-STABLE", leap=00, stratum=2, precision=-21, rootdelay=37.191, rootdisp=476.256, refid=209.51.161.238, reftime=e4233dba.ae57b7eb Thu, Apr 15 2021 18:33:30.681, clock=e42344a7.e24f1d1b Thu, Apr 15 2021 19:03:03.884, peer=60391, tc=7, mintc=3, offset=+1.048514, frequency=+38.158, sys_jitter=4.679301, clk_jitter=1.975, clk_wander=0.060 -
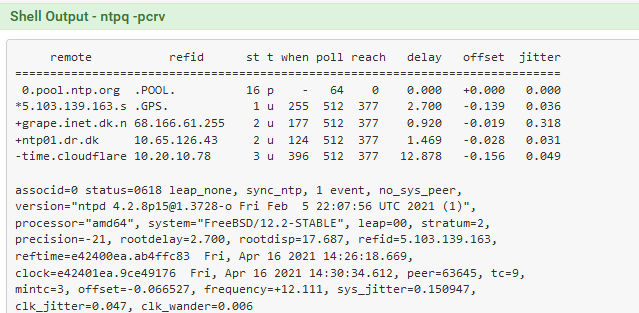
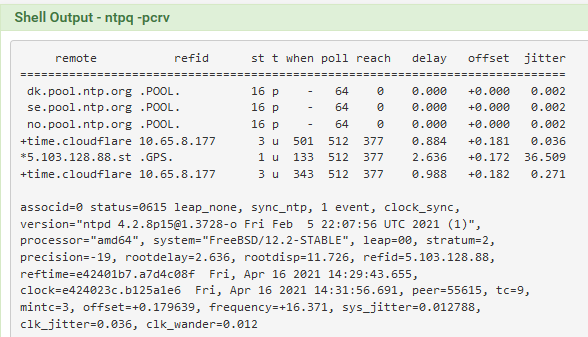
A couple of the connections we have.
-
Try changing pools
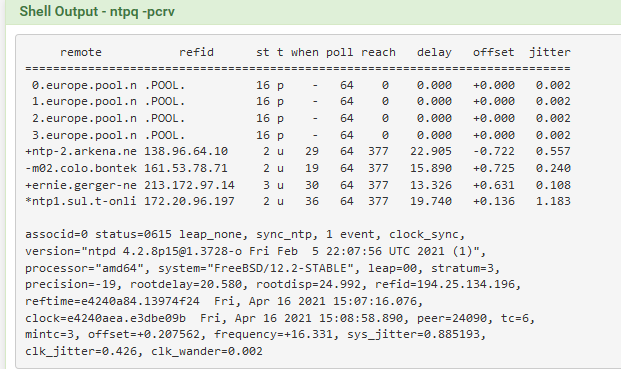
Changed mine from dk, se, no to 0,1,2,3.europe.pool.ntp.org
It bettered the jitter quite considerably.
-
@cool_corona
I'll try going back to multiple pool servers (.us.pool.ntp.org) - hopefully that will improve my current situation (status after 19 hours):[2.5.1-RELEASE][admin@pfsense.home]/var/log: ntpq -pcrv remote refid st t when poll reach delay offset jitter ============================================================================== 0.pfsense.pool. .POOL. 16 p - 64 0 0.000 +0.000 0.000 +tock.sol.net 206.55.64.77 3 u 41m 512 20 37.120 +1.937 1.621 -4.53.160.75 (ns 75.76.123.222 3 u 1722 512 70 26.891 +3.313 1.226 *frigg.fancube.c 107.46.198.112 2 u 1581 512 44 43.347 +3.275 2.363 associd=0 status=0618 leap_none, sync_ntp, 1 event, no_sys_peer, version="ntpd 4.2.8p15@1.3728-o Fri Feb 5 22:07:56 UTC 2021 (1)", processor="amd64", system="FreeBSD/12.2-STABLE", leap=00, stratum=3, precision=-21, rootdelay=49.680, rootdisp=77.172, refid=154.16.245.246, reftime=e4240ee1.afd0e2c4 Fri, Apr 16 2021 9:25:53.686, clock=e424150e.f3e02c84 Fri, Apr 16 2021 9:52:14.952, peer=60404, tc=9, mintc=3, offset=+1.958787, frequency=+37.805, sys_jitter=1.230244, clk_jitter=3.129, clk_wander=0.225 -
Make sure your logging your ntp, in the ntp settings.
And look for if ntp is seeing a spike and or resetting for other reasons. Your reaches should be 377, or maybe 1 packet missed now and then, or even a couple..
Those are horrible reach values.. And to be honest, the numbers don't even seem right.. Unless ntp is restarting or you missing a lot of packets..
You shouldn't see numbers like that, unless ntp has reset/restarted and is just starting... Or your loosing a lot of packets in a row..
20 for example, means that you have just restarted and you got 1 packet out of the last 5
10000 = 20 octal
So you have missed the last 4 packets after you got one, and before that you didn't have any.. Or 3 before that was missed 00010000
You really should never see a 20 as it starts up, because it wouldn't count up like that if your getting responses..
Your counts should be
1 = 1
11 = 3
111 = 7
1111 = 17
11111 = 37
111111 = 77
1111111 = 177
11111111 = 377Your reach values are pointing to a lot of unanswered queries..
your 44 value for example would be this for the last 8 packets..
00100100
So your only getting 1 out of every 3 queries?
70 = 00111000
So you got 3 in a row, and then last 3 nothing..
-
@johnpoz
I enabled the two logging options. here are the last 15 - not sure if 'unreachable' lines are a concern or normal.[2.5.1-RELEASE][admin@pfsense.home]/var/log: cat ntpd.log | tail -15 Apr 16 11:45:37 pfsense ntpd[76193]: Soliciting pool server 142.147.92.5 Apr 16 11:45:41 pfsense ntpd[76193]: 69.89.207.99 101a 8a sys_peer Apr 16 11:45:41 pfsense ntpd[76193]: 45.79.51.42 0014 84 reachable Apr 16 11:46:44 pfsense ntpd[76193]: Soliciting pool server 209.50.63.74 Apr 16 11:47:52 pfsense ntpd[76193]: Soliciting pool server 142.147.92.5 Apr 16 11:49:02 pfsense ntpd[76193]: Soliciting pool server 75.76.123.222 Apr 16 11:49:02 pfsense ntpd[76193]: 75.76.123.222 0011 81 mobilize assoc 33714 Apr 16 11:49:03 pfsense ntpd[76193]: Soliciting pool server 184.105.182.7 Apr 16 11:49:03 pfsense ntpd[76193]: 75.76.123.222 0014 84 reachable Apr 16 11:50:12 pfsense ntpd[76193]: Soliciting pool server 172.86.181.78 Apr 16 11:51:18 pfsense ntpd[76193]: Soliciting pool server 72.14.181.128 Apr 16 11:52:25 pfsense ntpd[76193]: Soliciting pool server 213.32.40.221 Apr 16 11:52:38 pfsense ntpd[76193]: 216.177.181.129 0014 84 reachable Apr 16 11:54:29 pfsense ntpd[76193]: 69.89.207.99 0613 83 unreachable Apr 16 11:55:52 pfsense ntpd[76193]: 45.79.51.42 0013 83 unreachable -
your prob going to want to look at more than the last 15 entries..
But unreachable isn't good no..
You can tell from your reach numbers your having a real hard time getting responses from the ntp your trying to talk too..
Those numbers your showing for reach values are not indicative of good connectivity.. Take your numbers and convert the octal number to a 8 digit binary and you can see response or no response for the last 8 you have sent.. To that specific IP.. When you are seeing the numbers you are seeing.. You have hard time talking to those ntp servers.. Be it they are not getting your query, or they are not just answering.. But those reach numbers are not good for keeping good time..
edit:
Maybe vs using pool, try some specific one that are in your geographic area
https://support.ntp.org/bin/view/Servers/StratumOneTimeServers
https://support.ntp.org/bin/view/Servers/StratumTwoTimeServersThere are plenty of ntp you can specific point to on the net.. You normally want something close as possible to you, to min the delay. But you for sure need something you can reliably talk too..
Add say time.cloudflare.com
They have like 180+ locations via anycast.. You should be able to hopefully talk to something reliable via that..
https://developers.cloudflare.com/time-services/ntp/usage -
@johnpoz
Changed to 5 individual servers closest to me. Here is status after 20 minutes:[2.5.1-RELEASE][admin@pfsense.home]/var/log: ntpq -p remote refid st t when poll reach delay offset jitter ============================================================================== time.cloudflare .INIT. 16 u - 512 0 0.000 +0.000 0.000 rolex.netservic .INIT. 16 u - 512 0 0.000 +0.000 0.000 rb.steadfastdns 208.100.0.253 2 u 176 64 74 18.244 +0.095 1.642 time.skylineser .INIT. 16 u - 512 0 0.000 +0.000 0.000 *ntp.your.org 204.9.51.33 2 u 701 64 0 20.320 +0.466 0.460