pfsense unresponsive (resolved)
-
Thank you for your response.
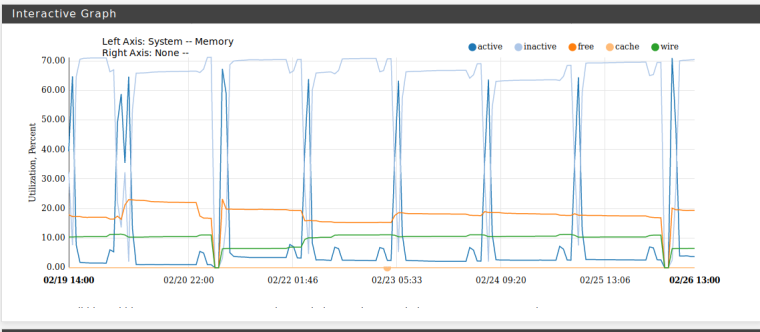
Looking at Status/Monitoring for memory usage over the last few days shows an increase memory requirement at the time the daily CRON job associated with pfblockerNG runs (04:15 am), however on some days e.g. 20/2 & 26/2 it consumes all memory types until none is left and the box become unresponsive.
Could it be there is some form of memory leak or error loop being triggered by pfblockerNG. Its the same job, same lists being downloaded each day, so I am baffled why it does it some days and not others.
Is it possible to put pfblockerNG into enhanced logging mode to capture more log data ?
-
I'd check the timestamps around those two drops of "free". It seems possible that at those time you somehow got out of RAM and SWAP but I'm not sure that it necessarily has something to do with pfBNG. As you mentioned Squid and Snortm they both are also known to be a bit on the larger size of using memory, so perhaps a list update from snort could also be the culprit?
-
Thanks for the further suggestions.
As I only very occasionally use Squid (for intercepting SSL packets) and it was in fact disabled I have removed it from the box (and the equation!).
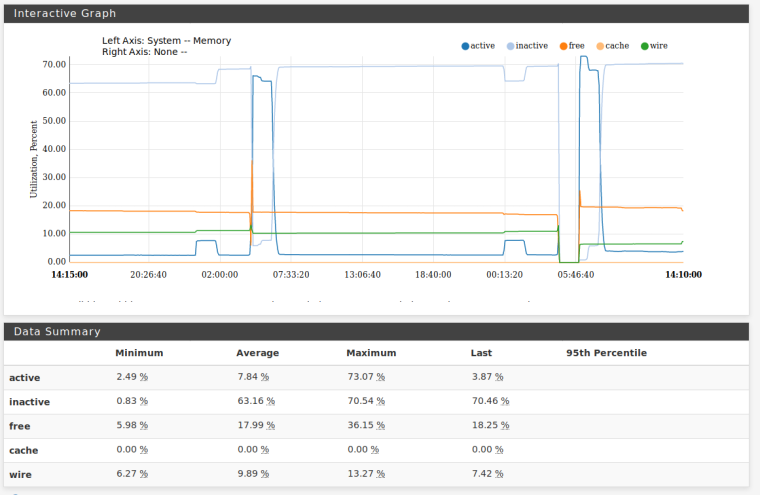
Having checked, I see that my SNORT update configuration is set to update twice a day - 00:05 & 12:05 hours. Looking at my memory usage over the last two days (see below) there does not seem to be any significant change in free memory available at these times ?
-
I would agree. The big drop seems to originate to around 0400 I'd guess. Anything in the logs around that timestamp?
-
Main System log seems clean ...
Feb 26 05:55:05 sshd 24404 Did not receive identification string from 192.168.123.112 port 60330
Feb 26 05:54:03 sshd 22206 Accepted keyboard-interactive/pam for admin from 192.168.123.112 port 60325 ssh2
Feb 26 05:54:03 sshd 22206 user admin login class [preauth]
Feb 26 05:54:03 sshd 22206 user admin login class [preauth]
Feb 26 04:27:23 kernel swap_pager_getswapspace(1): failed
Feb 26 04:27:23 kernel swap_pager_getswapspace(14): failed
Feb 26 04:27:23 kernel swap_pager_getswapspace(14): failed
Feb 26 04:16:46 php [pfBlockerNG] Starting cron process.
Feb 26 02:28:38 kernel arp: 192.168.123.130 moved from b8:27:eb:1f:d2:69 to b8:27:eb:4a:87:3c on igb1
Feb 26 00:17:19 kernel arp: 192.168.123.114 moved from b8:27:eb:1f:d2:69 to b8:27:eb:4a:87:3c on igb1
Feb 26 00:09:54 kernel pppoe0: promiscuous mode enabled
Feb 26 00:09:54 check_reload_status Syncing firewall
Feb 26 00:09:54 php /usr/local/pkg/snort/snort_check_for_rule_updates.php: [Snort] The Rules update has finished.
Feb 26 00:09:54 php /usr/local/pkg/snort/snort_check_for_rule_updates.php: [Snort] Snort has restarted with your new set of rules...
Feb 26 00:09:52 kernel ovpnc4: promiscuous mode enabled
Feb 26 00:09:52 kernel ovpnc1: promiscuous mode enabled
Feb 26 00:09:52 kernel ovpnc5: promiscuous mode enabled
Feb 26 00:09:52 kernel ovpnc3: promiscuous mode enabled
Feb 26 00:09:52 kernel ovpnc6: promiscuous mode enabled
Feb 26 00:09:51 php /usr/local/pkg/snort/snort_check_for_rule_updates.php: [Snort] Snort START for IVPN_BUL(ovpnc6)...
Feb 26 00:09:51 php /usr/local/pkg/snort/snort_check_for_rule_updates.php: [Snort] Snort START for IVPN_ES(ovpnc5)...
Feb 26 00:09:51 php /usr/local/pkg/snort/snort_check_for_rule_updates.php: [Snort] Snort START for IVPN_IT(ovpnc4)...
Feb 26 00:09:51 php /usr/local/pkg/snort/snort_check_for_rule_updates.php: [Snort] Snort START for IVPN_DE(ovpnc3)...
Feb 26 00:09:51 php /usr/local/pkg/snort/snort_check_for_rule_updates.php: [Snort] Snort START for IVPN_NL(ovpnc1)...
Feb 26 00:09:51 php /usr/local/pkg/snort/snort_check_for_rule_updates.php: [Snort] Snort START for WAN(pppoe0)...
Feb 26 00:09:48 kernel ovpnc6: promiscuous mode disabled -
Huh... As in my tests pfBNG never ran more than 2-3min it is strange. The cron was run at 4:16 and SWAP got killed at 4:27. That would indicate 11min... Do the other logs show anything in that timeframe besides pfBNG? Otherwise pfB should have some logs about its cron/update, perhaps that will shed some light into it.
-
In my experience, the update process has always taken circa 15 minutes to run. The system continues to be responsive and the only issue is DNS not resolving for approximately a minute or so at the very end whilst Unbound is reloaded.
The process today seems to have failed at the “validating databases” portion.
I have copied into the attached file (its quite lengthy) the pfblockerNG log for today and at the very foot (under ##########) the previous days log from this point onward so one can see what should have subsequently happened.
It strikes me that something within this process (a combination of circumstances is causing an issue, but not consistently) and was why I was looking to see if it was possible to activate some form of enhanced logging within pfblockerNG.
-
You are pushing the limit with 1.2M entries for DNSBL on a 8GB system. Remove 100000 to 200000 entries to get more free memory.
You could use BBC_DGA_High/381953 instead of BBC_DGA/875641.
-
Ron, thanks for your observation and remedial suggestion.
I have been running this setup for some time (>12 months) and it is only recently that I have encountered issues with pfsense running out of memory.
The one thing I think slightly odd, is that if the number of entries for DNSBL was excessive I would expect it to consistently hang, whereas its seems to be random, which makes me wonder (as previously stated) if there another issue at play (accepting I am probably stressing the system with the load).
I have coincidentally within the last month or so added an additional spamhaus drop list feed to the pfblockerNG configuration, so as an initial step I have removed this. I think it will be a question of wait and monitor.
If the problem returns I shall revisit my lists as per your recommendation.
-
@farrina said in pfsense unresponsive:
I have been running this setup for some time (>12 months) and it is only recently that I have encountered issues with pfsense running out of memory.
Well those lists grow constantly, so sooner or later they can hit a point where your hardware reaches it's limits.
The one thing I think slightly odd, is that if the number of entries for DNSBL was excessive I would expect it to consistently hang, whereas its seems to be random, which makes me wonder (as previously stated) if there another issue at play (accepting I am probably stressing the system with the load).
There are other processes on pfSense that will use increased memory from time to time, so it's always going to be a bit random. If one process is close to the border of the memory limits and nothing else is happening it's going to work, if another process currently needs more memory at that moment something will fail.
So either reduce the load on the hardware or upgrade to hardware that can take the load.
-
Thanks for taking the trouble to respond to my query with your thoughts.
I shall report back in due course with any developments,
-
Well problem has reoccurred, symptoms as previously described.
I have disabled the BBC_DGA feed which has reduced the number of entries on the DNSBL list from circa 1.2 million to 464K so this should (in theory) free up significant memory during pblockerNG updates each morning.
I'm struggling to locate your recommended feed (BBC_DGA_High) do you have a link by any chance ?
Cheers
-
@farrina https://osint.bambenekconsulting.com/feeds/
https://osint.bambenekconsulting.com/feeds/dga-feed-high.gz -
Thanks Ron
-
Just a quick follow up to my post to advise that my "problem" has not reoccurred since taking RonpfS advice to reduce the number of entries in my pfblockerNG block files.
Once again my thanks to all who took the trouble to respond.
Cheers