Memory Spike Reason Unknown
-
I am experiencing a memory spike from 18% to 80% (steady) and can not figure out why. The spike started at 7:30 this morning and I do not see what is causing it, I did not make any changes to pfSense config but did block a mac address on my AP and switch which was associated with a device that is not known to belong to this network, I did not create a FW rule as I expect the unknown device to get dropped upstream before hitting the FW. I know there was another thread (locked) that talked about mem spikes but does not seem to be related to my situation. I did a reboot and the usage seems to have settled back down to 15% for now but knowing how to diagnose such things would be a big help. Also in an attempt to identify how the memory was being used I ssh'd into the FW using putty but the "$" commands were not recognized so I also have that to look into as well. I am new to this so am trying to navigate my way through the honeymoon period and appreciate any constructive feedback. Thanks again.
-
Diagnostics/System Activity will show processes and their RAM usage.
-
At the CLI run
top -aSHthen set the sort order (press 'o') to RES. What's using the RAM?Steve
-
@steveits Thanks much for the feedback, I did a restart and things seem to have quieted down but still digging to see what caused the issue, your suggestion most welcomed and appreciated.
-
@stephenw10 That seems to have gotten some results (see below). I know this is going to be a silly question, but seems like the traditional FreeBSD commands dont work in this instance and a search for "pfsense ssh cli commands" doesnt yield anything I can use, is there a reference I can use for the future? I restarted the system and seems things have quieted down but have provided the results of the mem results just incase. Thanks for the quick reply.
PID USERNAME PRI NICE SIZE RES STATE C TIME WCPU COMMAND 85223 unbound 20 0 71M 50M kqread 0 0:09 0.10% /usr/local/sbin/unbound -c /var/unbound/unbound.conf{unbound} 85223 unbound 20 0 71M 50M kqread 0 0:06 0.05% /usr/local/sbin/unbound -c /var/unbound/unbound.conf{unbound} 347 root 20 0 102M 40M accept 0 0:17 1.19% php-fpm: pool nginx (php-fpm) 348 root 52 0 102M 40M accept 0 0:20 0.00% php-fpm: pool nginx (php-fpm) 65336 root 52 0 102M 40M accept 0 0:17 0.00% php-fpm: pool nginx (php-fpm) 95287 root 52 0 102M 40M accept 1 0:14 0.00% php-fpm: pool nginx (php-fpm) 47271 root 25 0 102M 39M accept 0 0:10 0.87% php-fpm: pool nginx (php-fpm) 14264 squid 20 0 99M 38M kqread 0 0:05 0.04% (squid-1) --kid squid-1 -f /usr/local/etc/squid/squid.conf (squid) 60198 root 20 0 59M 37M piperd 0 0:01 0.01% /usr/local/bin/php_pfb -f /usr/local/pkg/pfblockerng/pfblockerng.inc filterlog 56304 root 20 0 59M 37M piperd 0 0:02 0.00% /usr/local/bin/php -f /usr/local/pkg/pfblockerng/pfblockerng.inc index 56281 root 20 0 59M 37M piperd 1 0:01 0.00% /usr/local/bin/php -f /usr/local/pkg/pfblockerng/pfblockerng.inc dnsbl 346 root 20 0 102M 27M kqread 0 0:00 0.01% php-fpm: master process (/usr/local/lib/php-fpm.conf) (php-fpm) 13825 squid 52 0 28M 15M wait 0 0:00 0.00% /usr/local/sbin/squid -f /usr/local/etc/squid/squid.conf 99388 dhcpd 20 0 22M 11M select 1 0:01 0.02% /usr/local/sbin/dhcpd -user dhcpd -group _dhcp -chroot /var/dhcpd -cf /etc/dhcpd.conf -pf /var/r 74822 cap 20 0 20M 9224K select 0 0:00 0.02% sshd: cap@pts/0 (sshd) 54725 root 24 0 20M 9192K select 1 0:00 0.00% sshd: cap[priv] (sshd) 89866 root 20 0 29M 8976K kqread 1 0:03 0.00% nginx: worker process (nginx) 56077 root 20 0 19M 8932K kqread 0 0:03 0.00% /usr/local/sbin/lighttpd_pfb -f /var/unbound/pfb_dnsbl_lighty.conf 89977 root 20 0 29M 8792K kqread 1 0:04 0.18% nginx: worker process (nginx) 18591 squid 20 0 18M 8496K select 0 0:02 0.03% (pinger) (pinger) 5208 root 20 0 19M 8212K nanslp 0 0:10 0.13% /usr/local/sbin/pcscd{pcscd} 5208 root 20 0 19M 8212K select 1 0:00 0.00% /usr/local/sbin/pcscd{pcscd} 5208 root 52 0 19M 8212K piperd 0 0:00 0.00% /usr/local/sbin/pcscd{pcscd} 6574 root 20 0 19M 8072K select 0 0:00 0.00% /usr/sbin/sshd 89773 root 52 0 28M 7632K pause 1 0:00 0.00% nginx: master process /usr/local/sbin/nginx -c /var/etc/nginx-webConfigurator.conf (nginx) 27949 root 20 0 17M 7268K kqread 0 0:00 0.00% /usr/local/sbin/lighttpd_ls -f /var/etc/lightsquid/lighttpd_ls.conf 91570 root 20 0 19M 6836K select 1 0:02 0.01% /usr/local/sbin/ntpd -g -c /var/etc/ntpd.conf -p /var/run/ntpd.pid{ntpd} 98198 cap 20 0 15M 5316K CPU0 0 0:01 0.33% top -aSH -
Nothing there looks too huge when that was taken.
FreeBSD commands should work, it's just FreeBSD at the command line. What are you trying to run?
Steve
-
It spiked back up to 33% and am looking for the culprit, I think it may be squid related.
-
Squid can use a lot of RAM especially if you have non-default local cache settings. How much RAM do you have on that box?
-
@stephenw10 4gb...what do you suggest to ensure not over using resources when not needed? Thank you.
-
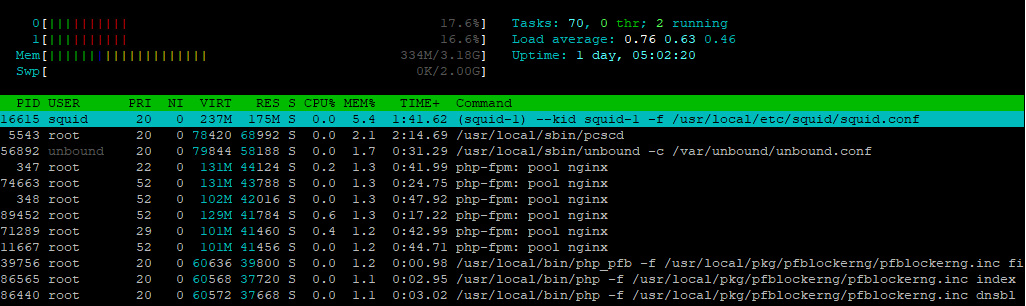
Try this one :
pkg install htopNow you have htop at your dispossal ;)
And a question : when I sort on memory usage :
Who is this :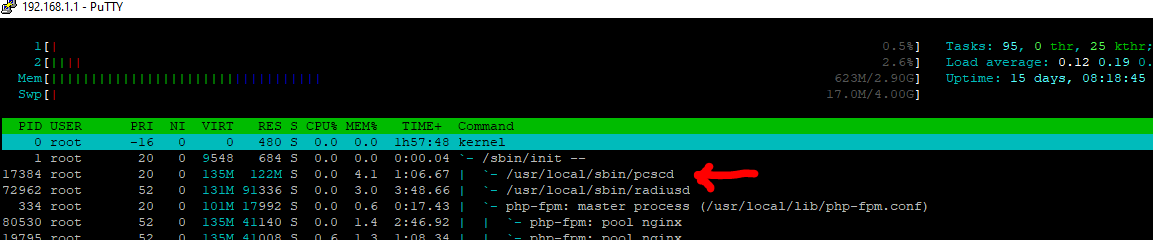
It's also rather new here :

( I know, Google shuld be my friend .... )
-
-
Interesting, on a 3100 it shows as:
Mem: 31M Active, 1156M Inact, 199M Wired, 83M Buf, 594M Free
PID USERNAME PRI NICE SIZE RES STATE C TIME WCPU COMMAND
13149 root 20 0 960M 950M nanslp 1 32:47 0.06% /usr/local/sbin/pcscd{pcscd}
13149 root 20 0 960M 950M select 1 1:19 0.00% /usr/local/sbin/pcscd{pcscd}
13149 root 52 0 960M 950M piperd 1 0:00 0.00% /usr/local/sbin/pcscd{pcscd}Yet the dashboard shows "Memory usage 12% of 2017 MiB" (242 MB).
On a PC with 2.5.2 it shows as:
Mem: 87M Active, 2768M Inact, 972M Wired, 592M Buf, 3296M Free
Swap: 3852M Total, 3852M FreePID USERNAME PRI NICE SIZE RES STATE C TIME WCPU COMMAND
7457 root 20 0 1946M 1928M nanslp 3 21:30 0.08% /usr/local/sbin/pcscd{pcscd}
7457 root 20 0 1946M 1928M select 2 0:30 0.00% /usr/local/sbin/pcscd{pcscd}
7457 root 52 0 1946M 1928M piperd 1 0:00 0.00% /usr/local/sbin/pcscd{pcscd}and the dashboard memory usage "15% of 7314 MiB" (1097.1).
The dashboard must not be counting it?
-
Yeah, in most cases it doesn't actually seem to cause a problem. But it shouldn't behave like that and it will not be enabled by default in the next release.
https://redmine.pfsense.org/issues/11933Steve
-
@gertjan Now that htop is the bomb, great call. Now if I can find info packed dashboard alternatives I will be on my way.
-
Using htop I was able to see that 5+% of the 33% mem being used was in use by squid...Is that normal in a basic out of the box config (1 wan IF and 1 Lan IF <12 internal ip addresses)?
-
Too many variables to say what's 'normal' there really. But unused RAM is pointless so something using 5% of 4GB would not concern me.
Steve
-
@stephenw10 Yeah makes sense, what caught my attention was the % used in the dashboard, I used to run at 18% then saw 33 made me wonder. I can really do with a new dashboard, I saw some discussions on other boards about them but they seem time consuming to build but they looked sweet and you can really get creative with what is displayed.