pfsense 2.5.2 slowly leaking memory
-
Turns out the biggest memory hog was pfblocker unbound mode. When I switched to python mode I see significant memory savings.
-
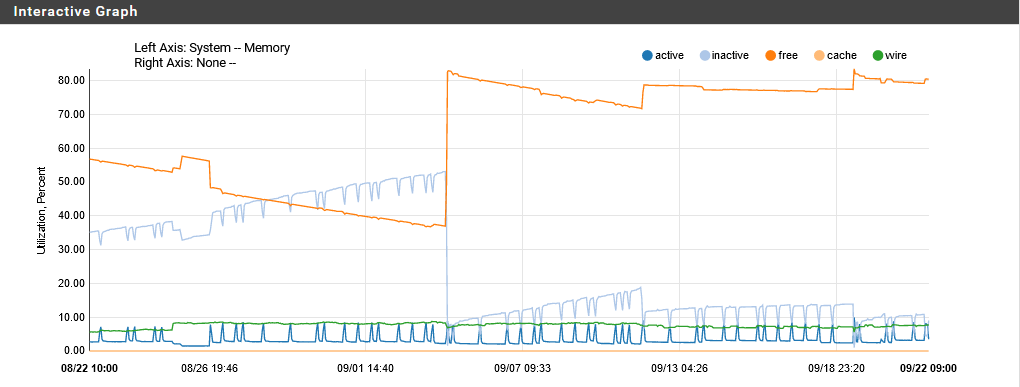
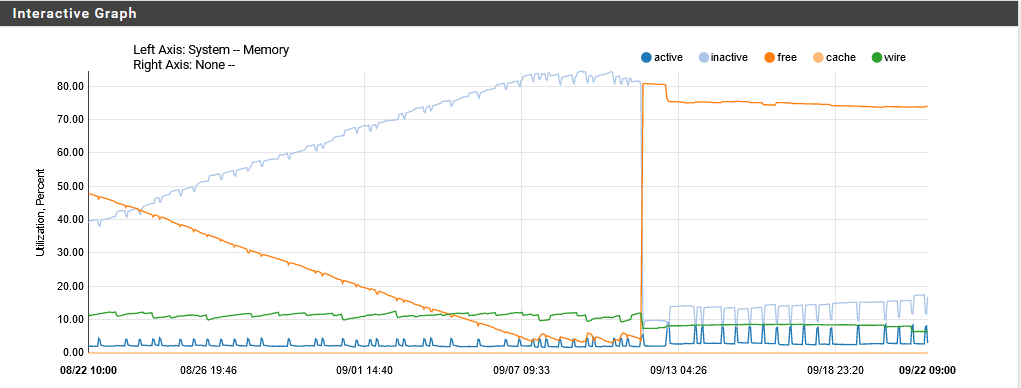
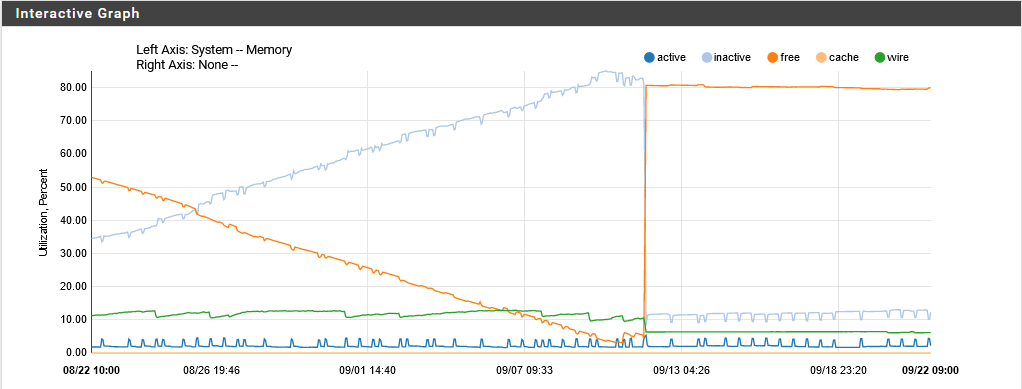
Huge difference in systems all running the same config.
-
@murzik I agree, 2.5.2 is acting weird.
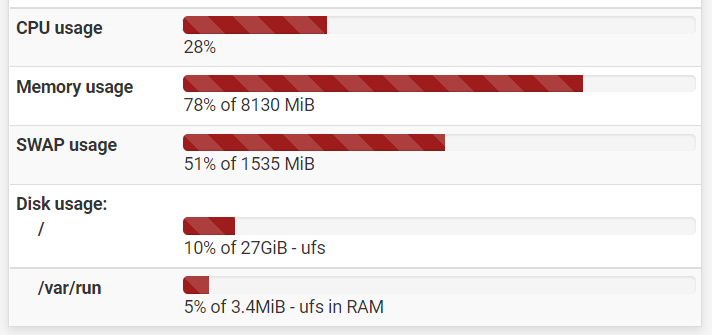
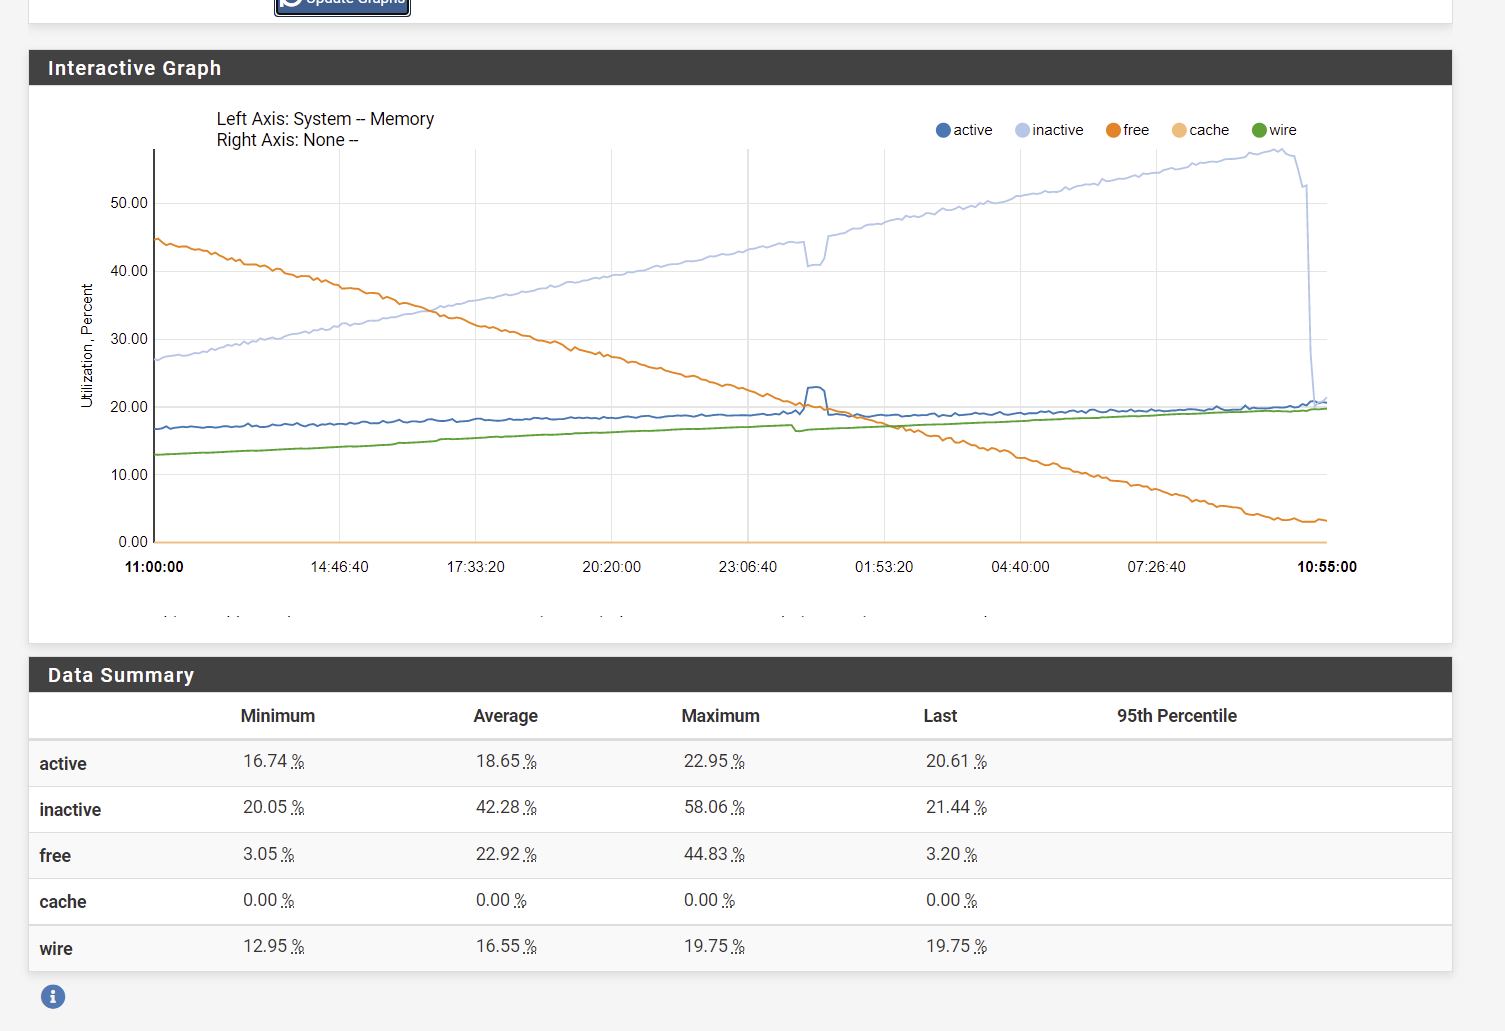
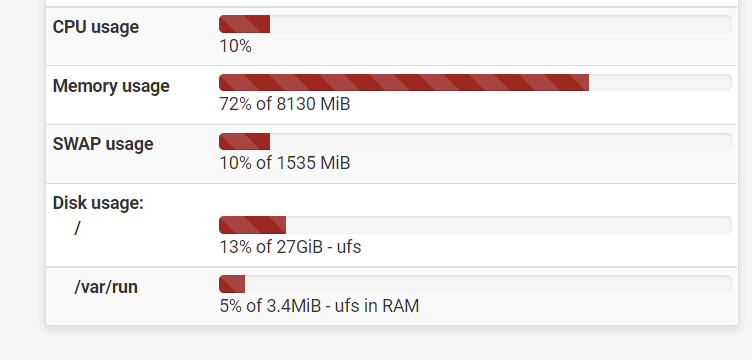
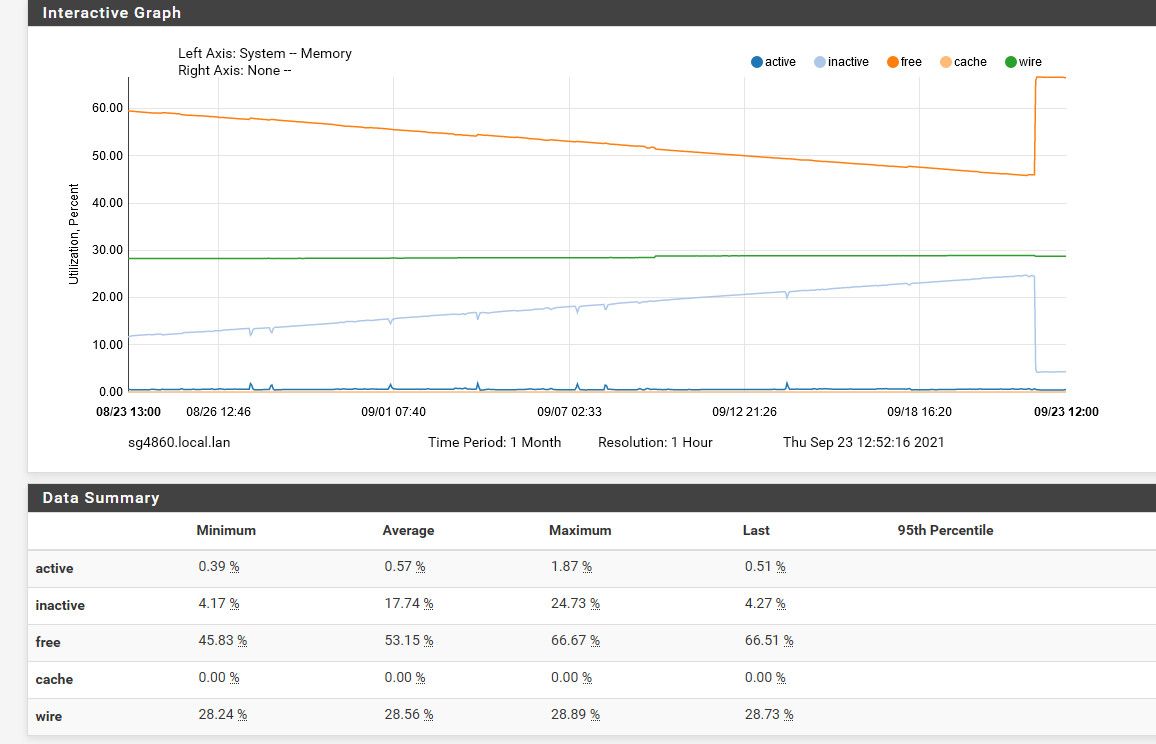
On a system with 4GB of ram and 2GB of swap, after 70 days, I notice unusual behavior.
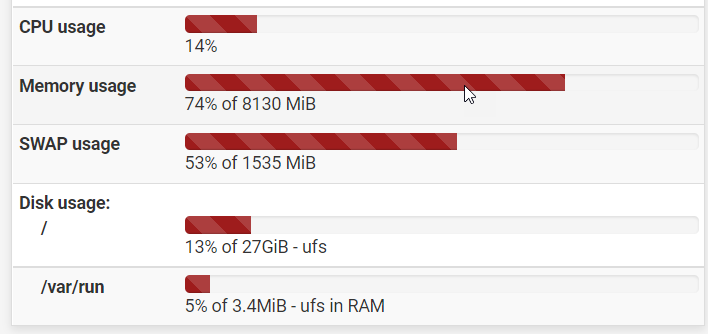
Ram and swap usage is at 60%, however, I have never ever seen swap usage before, even after months of uptime.
My setup is really basic, no ressource hungry addons of any kind.
-
@cool_corona you say "same config"; is it same hardware, same set of packages, same functionality in your network?
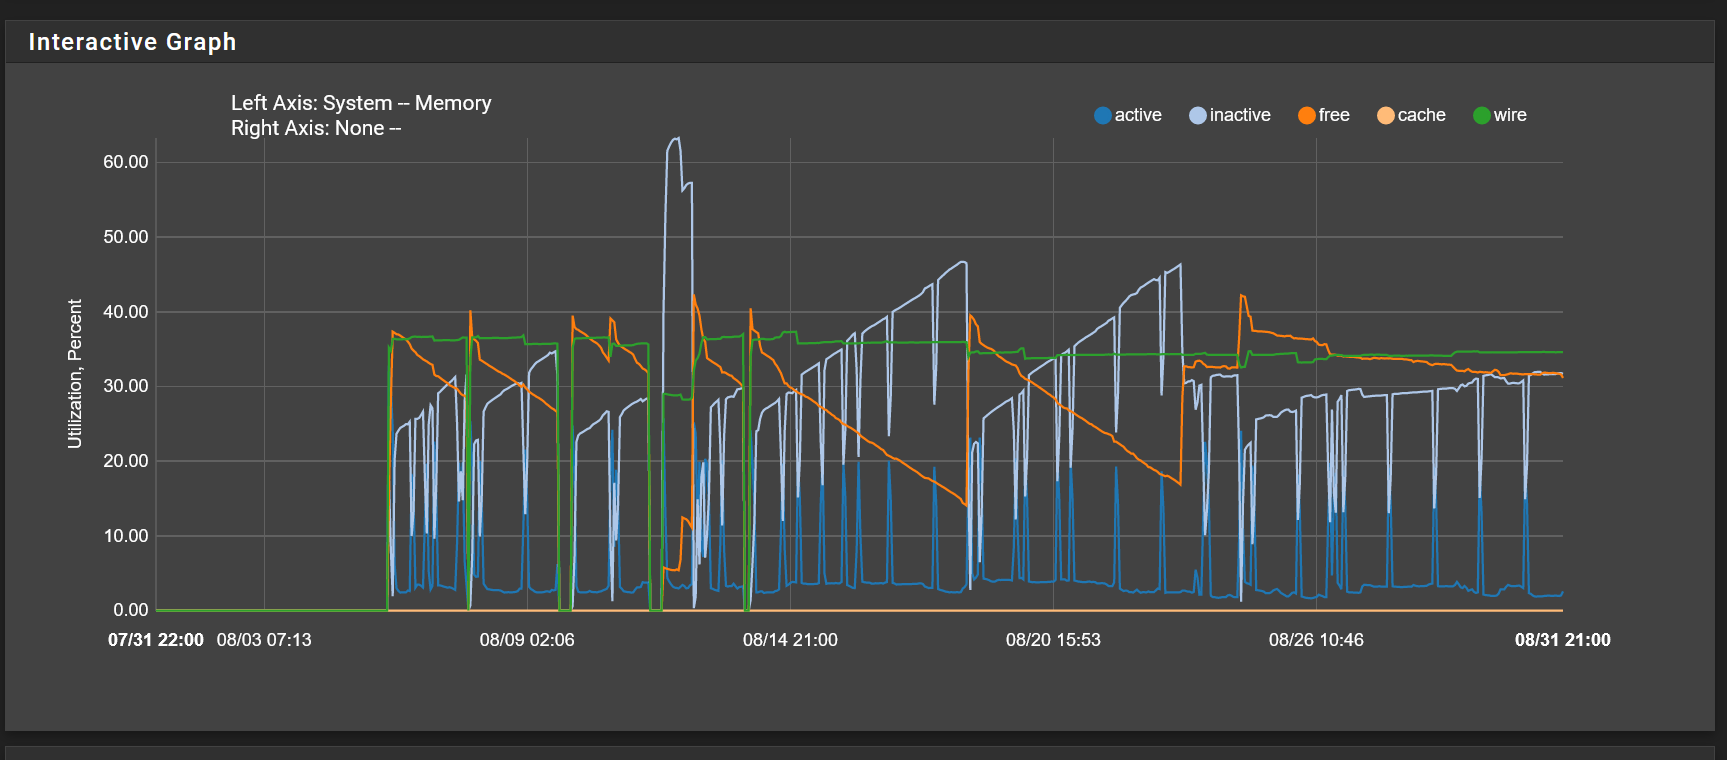
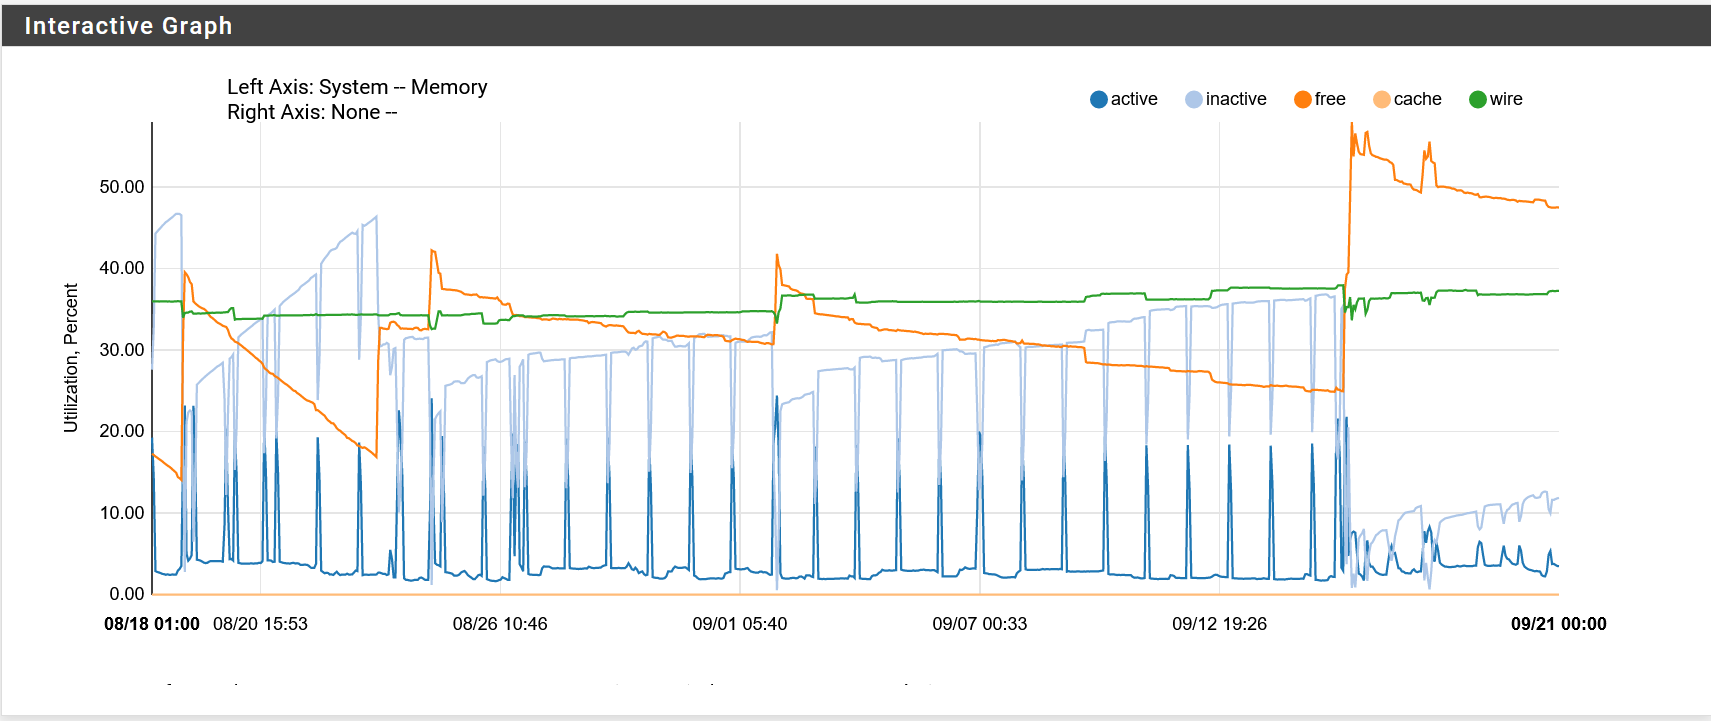
Just curious because your graphs are "interesting" -
@mer Exactly the same.
-
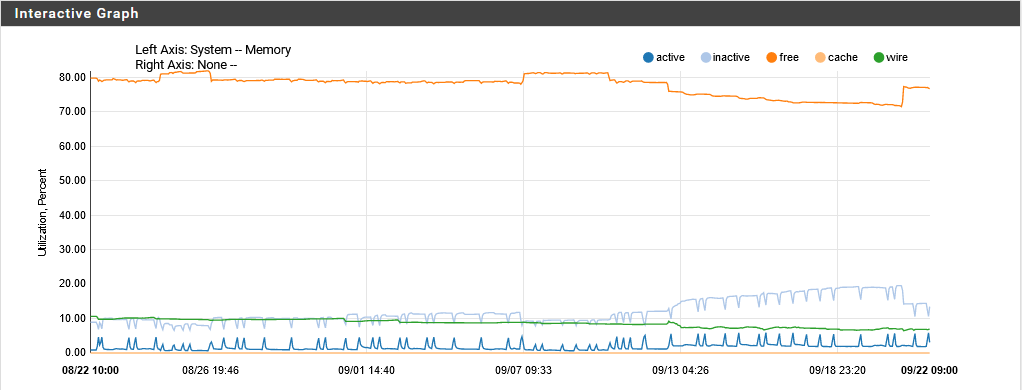
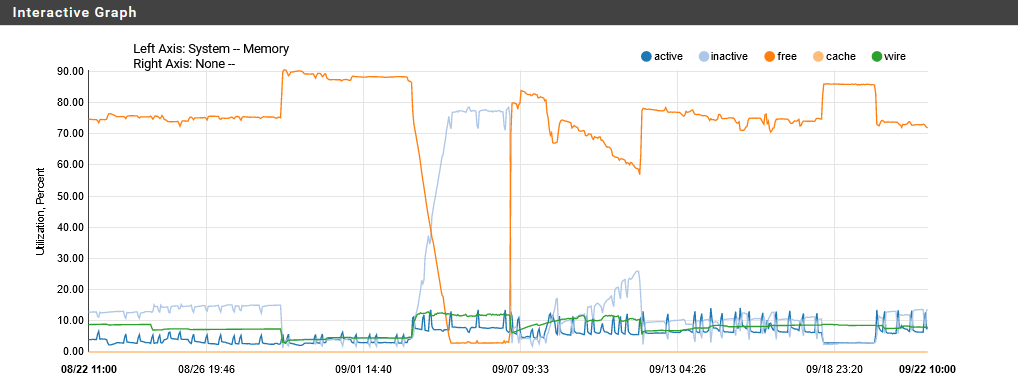
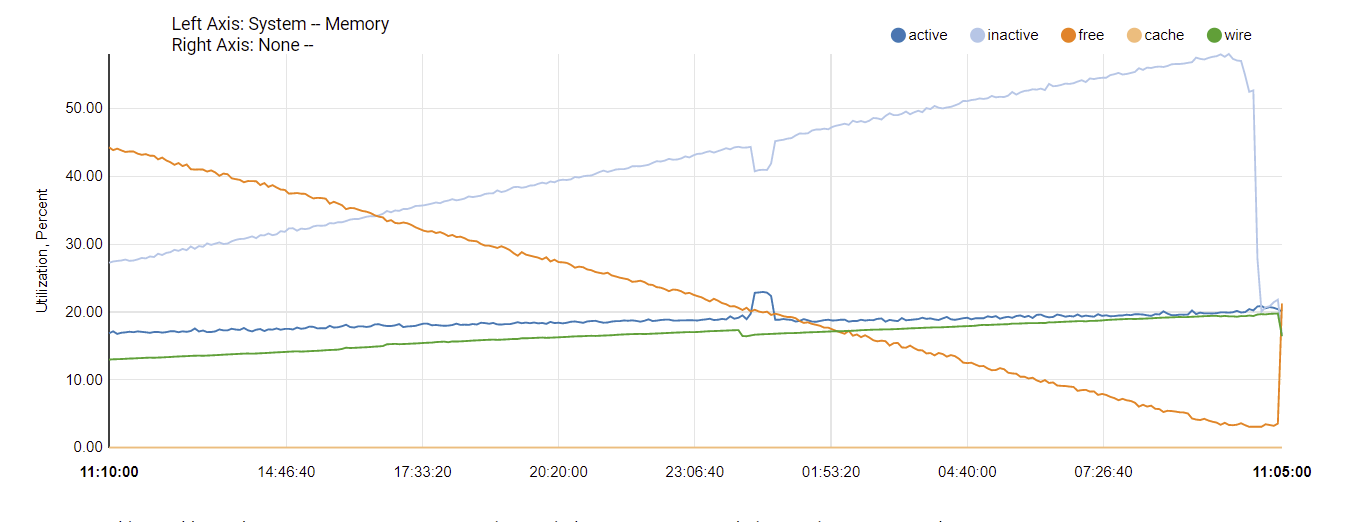
Just for one day
After reboot
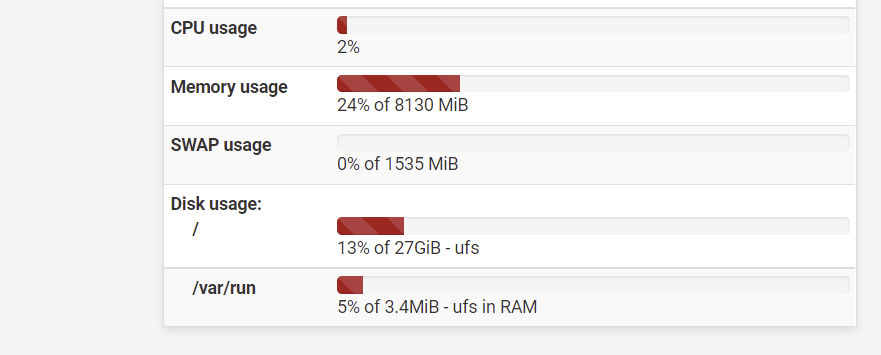
-
@murzik And just to be clear, you've patched for the pcscd issue and/or that service is stopped (Status/Services)? We do have one 2.5.2 and its graphs are literally flat today except at 6:30 this morning when free memory increased 1%. That's when Suricata updates.
Do you have pfBlocker's DNSBL active, or any other packages?
-
You can see exactly when I turned off pcscd a couple of days ago.. I thought I had stopped it, but it was running again..
-
Yes, I've patched pcscd. Do have pfblocker, snort, squid installed. But I had all the same packages for years.
-
@murzik I don't use DNSBL or Squid but you might read this recent post about pfBlocker.
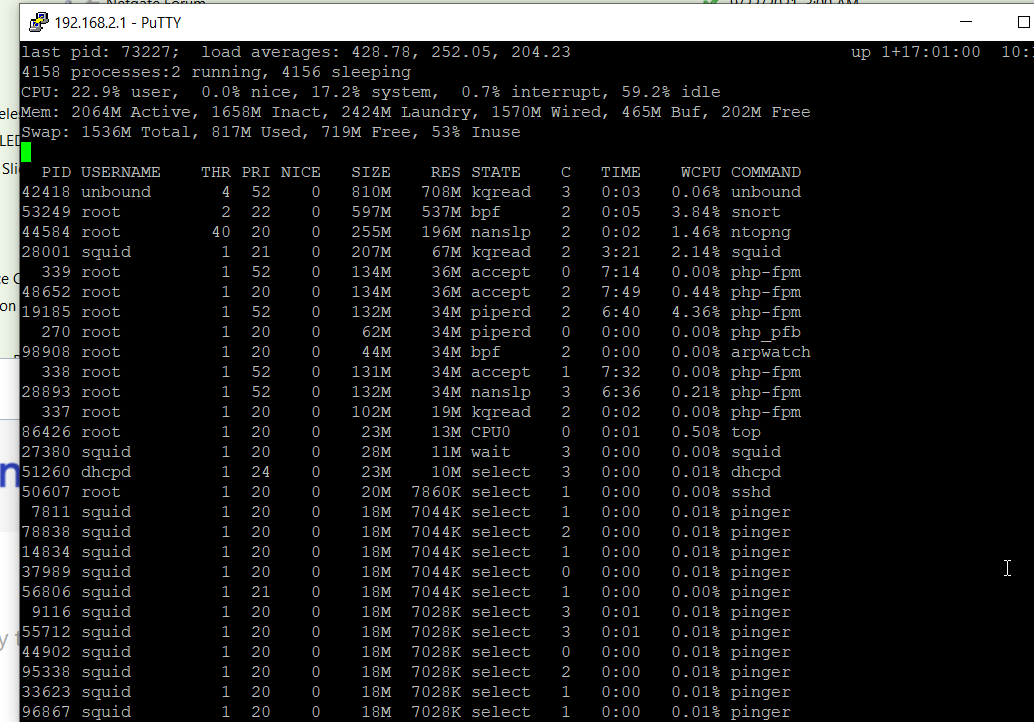
You could try looking at Diagnostics/System Activity, or run "top -o res" (sort by memory) at a command line, and see what is using the memory. I get:
PID USERNAME THR PRI NICE SIZE RES STATE C TIME WCPU COMMAND 81511 root 10 20 0 381M 337M nanslp 0 586:13 1.49% suricata 89847 root 1 52 0 135M 47M accept 0 0:29 0.00% php-fpm 93096 root 1 21 0 133M 46M accept 0 0:13 0.29% php-fpm 11372 root 1 52 0 132M 45M accept 1 0:03 0.00% php-fpm 338 root 1 52 0 133M 45M accept 0 0:11 0.00% php-fpm 337 root 1 52 0 132M 44M accept 1 0:34 0.00% php-fpm 26574 root 1 52 0 59M 38M piperd 1 0:00 0.00% php_pfb 73546 unbound 4 20 0 68M 32M kqread 1 1:17 0.00% unbound 336 root 1 20 0 102M 25M kqread 0 1:25 0.00% php-fpm 37003 root 1 20 0 29M 9648K kqread 2 0:07 0.05% nginx 36796 root 1 20 0 29M 9644K kqread 3 0:03 0.00% nginx ... -
@steveits
The problem not what application uses the most memory, but that memory usage grow over the time. I have to reboot every other day.
Also memory usage displayed with "top -o res" does not account for all memory used memory shown in GUI.
Stopping PF blocker does not free memory. -
@murzik said in pfsense 2.5.2 slowly leaking memory:
memory usage grow over the time
I was assuming there was a particular process increasing in size. If it's multiple processes that would make it a bit harder to diagnose, perhaps just watch over time. But if it isn't happening to everyone then it seems like it's not a generic FreeBSD/pfSense problem...
That said unbound on the two routers I just looked at is much smaller than 700 MB, around 30-50 MB. We don't have pfBlocker's DNSBL running though.
-
pfBlockerNG, the DNSBL part : you're using the python mode ?
My unbound process is one of the biggest (but not the biggest) process in my system, but stays at around 100 Mbytes :
96339 unbound 2 20 0 101M 95M kqread 0 0:03 0.37% unbound -
@murzik said in pfsense 2.5.2 slowly leaking memory:
I have to reboot every other day.
What happens if you do not reboot it?
That is something leaking quite fast if you are using 8GB in 2 days.
Steve
-
@stephenw10
If I do not reboot, pfsense will use up all the memory and swap and crash. -
@gertja
Yes, I do use DNSBL in python mode. But I've been using it in python mode since it become available without any issues.... Also disabling DNSBL, restarting unbond, snort etc, does not free any memory.... -
@murzik said in pfsense 2.5.2 slowly leaking memory:
pfsense will use up all the memory and swap and crash
We can't see your process list...you'll need to tell us which processes are using up the memory.
-
@steveits Unfortunately I am not able to tell. When system crashes it is too late to check. However, I am starting to suspect that ntopng could be the problem. I remoted ntopng yesterday, so far memory usage stays around 30% . Will see in few days.
-
@murzik said in pfsense 2.5.2 slowly leaking memory:
ntopng
Aha !
You to forget to mention that you were using the big resource hog, the beast that should be set up carefully, and has to be managed 24/24h.
Tools like ntopng should not be left alone, as it files up files rapidly.
Most 'space' issues are not the RAM that starts too be consumed, but your entire disk space.
The result is the same : booooom.
With a full RAM and swap : the system goes down - but can restart it without issues. That is, if the file system wasn't corrupted when doing the unplanned system reboot.
A full file system : your system won't boot any more. -
@gertjan
Apparently ntopng was not the cause. As of right now