Gateway monitor down
-
I did a bit more troubleshooting and got interesting results:
- Tests from my wired desktop client directly connected to the ISP ONU:
C:\Users\Kevin>ping 112.204.224.1 -t Pinging 112.204.224.1 with 32 bytes of data: Reply from 112.204.224.1: bytes=32 time=3ms TTL=255 Reply from 112.204.224.1: bytes=32 time=3ms TTL=255 Reply from 112.204.224.1: bytes=32 time=3ms TTL=255 Reply from 112.204.224.1: bytes=32 time=3ms TTL=255 Reply from 112.204.224.1: bytes=32 time=1ms TTL=255 Reply from 112.204.224.1: bytes=32 time=3ms TTL=255 Reply from 112.204.224.1: bytes=32 time=3ms TTL=255 Reply from 112.204.224.1: bytes=32 time=13ms TTL=255 Reply from 112.204.224.1: bytes=32 time=17ms TTL=255 Reply from 112.204.224.1: bytes=32 time=3ms TTL=255 Reply from 112.204.224.1: bytes=32 time=3ms TTL=255 Reply from 112.204.224.1: bytes=32 time=3ms TTL=255 Reply from 112.204.224.1: bytes=32 time=3ms TTL=255 Reply from 112.204.224.1: bytes=32 time=3ms TTL=255 Ping statistics for 112.204.224.1: Packets: Sent = 14, Received = 14, Lost = 0 (0% loss), Approximate round trip times in milli-seconds: Minimum = 1ms, Maximum = 17ms, Average = 4ms Control-C ^C C:\Users\Kevin>tracert 112.204.224.1 Tracing route to 112.204.224.1.pldt.net [112.204.224.1] over a maximum of 30 hops: 1 2 ms 3 ms 2 ms 112.204.224.1.pldt.net [112.204.224.1] Trace complete. C:\Users\Kevin>ping 8.8.8.8 -t Pinging 8.8.8.8 with 32 bytes of data: Reply from 8.8.8.8: bytes=32 time=27ms TTL=58 Reply from 8.8.8.8: bytes=32 time=27ms TTL=58 Reply from 8.8.8.8: bytes=32 time=27ms TTL=58 Reply from 8.8.8.8: bytes=32 time=27ms TTL=58 Reply from 8.8.8.8: bytes=32 time=27ms TTL=58 Reply from 8.8.8.8: bytes=32 time=27ms TTL=58 Reply from 8.8.8.8: bytes=32 time=27ms TTL=58 Reply from 8.8.8.8: bytes=32 time=28ms TTL=58 Reply from 8.8.8.8: bytes=32 time=49ms TTL=58 Reply from 8.8.8.8: bytes=32 time=27ms TTL=58 Reply from 8.8.8.8: bytes=32 time=27ms TTL=58 Reply from 8.8.8.8: bytes=32 time=27ms TTL=58 Reply from 8.8.8.8: bytes=32 time=27ms TTL=58 Reply from 8.8.8.8: bytes=32 time=28ms TTL=58 Reply from 8.8.8.8: bytes=32 time=27ms TTL=58 Reply from 8.8.8.8: bytes=32 time=27ms TTL=58 Reply from 8.8.8.8: bytes=32 time=27ms TTL=58 Reply from 8.8.8.8: bytes=32 time=27ms TTL=58 Reply from 8.8.8.8: bytes=32 time=28ms TTL=58 Reply from 8.8.8.8: bytes=32 time=28ms TTL=58 Reply from 8.8.8.8: bytes=32 time=27ms TTL=58 Reply from 8.8.8.8: bytes=32 time=27ms TTL=58 Reply from 8.8.8.8: bytes=32 time=27ms TTL=58 Reply from 8.8.8.8: bytes=32 time=27ms TTL=58 Reply from 8.8.8.8: bytes=32 time=27ms TTL=58 Reply from 8.8.8.8: bytes=32 time=27ms TTL=58 Reply from 8.8.8.8: bytes=32 time=27ms TTL=58 Reply from 8.8.8.8: bytes=32 time=27ms TTL=58 Reply from 8.8.8.8: bytes=32 time=27ms TTL=58 Reply from 8.8.8.8: bytes=32 time=28ms TTL=58 Reply from 8.8.8.8: bytes=32 time=27ms TTL=58 Ping statistics for 8.8.8.8: Packets: Sent = 31, Received = 31, Lost = 0 (0% loss), Approximate round trip times in milli-seconds: Minimum = 27ms, Maximum = 49ms, Average = 27ms Control-C ^C C:\Users\Kevin>tracert 8.8.8.8 Tracing route to dns.google [8.8.8.8] over a maximum of 30 hops: 1 3 ms 3 ms 3 ms 112.204.224.1.pldt.net [112.204.224.1] 2 4 ms 3 ms 3 ms 122.2.187.142.static.pldt.net [122.2.187.142] 3 * * * Request timed out. 4 27 ms 27 ms 28 ms 210.213.130.103.static.pldt.net [210.213.130.103] 5 29 ms 28 ms 29 ms 74.125.118.24 6 28 ms 28 ms 28 ms 209.85.244.25 7 24 ms 23 ms 23 ms 216.239.42.89 8 27 ms 27 ms 27 ms dns.google [8.8.8.8] Trace complete.- Tests from the same wired desktop client connected through my ASUS RT-AC66U (acting as a switch), the same switch connected to my pfsense box, and the ISP ONU connected to the same pfsense box:
C:\Users\Kevin>ping 112.205.32.1 -t Pinging 112.205.32.1 with 32 bytes of data: Reply from 112.205.32.1: bytes=32 time=2ms TTL=254 Reply from 112.205.32.1: bytes=32 time=1ms TTL=254 Reply from 112.205.32.1: bytes=32 time=6ms TTL=254 Reply from 112.205.32.1: bytes=32 time=2180ms TTL=254 Reply from 112.205.32.1: bytes=32 time=1571ms TTL=254 Reply from 112.205.32.1: bytes=32 time=52ms TTL=254 Reply from 112.205.32.1: bytes=32 time=448ms TTL=254 Reply from 112.205.32.1: bytes=32 time=1ms TTL=254 Reply from 112.205.32.1: bytes=32 time=3ms TTL=254 Reply from 112.205.32.1: bytes=32 time=2ms TTL=254 Reply from 112.205.32.1: bytes=32 time=740ms TTL=254 Reply from 112.205.32.1: bytes=32 time=523ms TTL=254 Reply from 112.205.32.1: bytes=32 time=1275ms TTL=254 Reply from 112.205.32.1: bytes=32 time=1318ms TTL=254 Reply from 112.205.32.1: bytes=32 time=17ms TTL=254 Reply from 112.205.32.1: bytes=32 time=88ms TTL=254 Reply from 112.205.32.1: bytes=32 time=4ms TTL=254 Reply from 112.205.32.1: bytes=32 time=3ms TTL=254 Reply from 112.205.32.1: bytes=32 time=3ms TTL=254 Reply from 112.205.32.1: bytes=32 time=523ms TTL=254 Ping statistics for 112.205.32.1: Packets: Sent = 20, Received = 20, Lost = 0 (0% loss), Approximate round trip times in milli-seconds: Minimum = 1ms, Maximum = 2180ms, Average = 438ms Control-C ^C C:\Users\Kevin>tracert 112.205.32.1 Tracing route to 112.205.32.1.pldt.net [112.205.32.1] over a maximum of 30 hops: 1 <1 ms <1 ms <1 ms pfSense.condo.arpa [192.168.20.1] 2 1955 ms 235 ms 94 ms 112.205.32.1.pldt.net [112.205.32.1] Trace complete. C:\Users\Kevin>tracert 8.8.8.8 Tracing route to dns.google [8.8.8.8] over a maximum of 30 hops: 1 <1 ms <1 ms 1 ms pfSense.condo.arpa [192.168.20.1] 2 1193 ms 1072 ms 1043 ms 112.205.32.1.pldt.net [112.205.32.1] 3 11 ms 4 ms 3 ms 122.2.187.146.static.pldt.net [122.2.187.146] 4 * * * Request timed out. 5 615 ms 1429 ms 122 ms 210.213.130.103.static.pldt.net [210.213.130.103] 6 1646 ms 847 ms 769 ms 72.14.195.168 7 24 ms 23 ms 21 ms 108.170.231.19 8 245 ms 917 ms 46 ms 209.85.143.37 9 1570 ms 1371 ms 70 ms dns.google [8.8.8.8] Trace complete.- Tests from the pfsense diagnostic tools when ISP ONU is connected to it. I've made sure that traceroute using ping (instead of the default UDP) so that it mirrors exactly what tracert in Windows does.
PING 112.205.32.1 (112.205.32.1): 56 data bytes
64 bytes from 112.205.32.1: icmp_seq=0 ttl=255 time=789.747 ms
64 bytes from 112.205.32.1: icmp_seq=1 ttl=255 time=3276.583 ms
64 bytes from 112.205.32.1: icmp_seq=2 ttl=255 time=2379.589 ms
64 bytes from 112.205.32.1: icmp_seq=3 ttl=255 time=1405.570 ms
64 bytes from 112.205.32.1: icmp_seq=4 ttl=255 time=407.121 ms
64 bytes from 112.205.32.1: icmp_seq=5 ttl=255 time=2.525 ms
64 bytes from 112.205.32.1: icmp_seq=6 ttl=255 time=3.033 ms
64 bytes from 112.205.32.1: icmp_seq=7 ttl=255 time=1.394 ms
64 bytes from 112.205.32.1: icmp_seq=8 ttl=255 time=314.137 ms
64 bytes from 112.205.32.1: icmp_seq=9 ttl=255 time=594.438 ms

--- 112.205.32.1 ping statistics ---
10 packets transmitted, 10 packets received, 0.0% packet loss
round-trip min/avg/max/stddev = 1.394/917.414/3276.583/1058.258 ms
1 112.205.32.1.pldt.net (112.205.32.1) 500.894 ms 66.996 ms 942.851 ms1 112.205.32.1.pldt.net (112.205.32.1) 1.776 ms 2.692 ms 3.052 ms 2 122.2.187.146.static.pldt.net (122.2.187.146) 2.664 ms 1.913 ms 3.742 ms 3 * * * 4 210.213.130.103.static.pldt.net (210.213.130.103) 534.225 ms 804.088 ms 139.527 ms 5 72.14.195.168 (72.14.195.168) 24.507 ms 22.051 ms 23.182 ms 6 108.170.231.19 (108.170.231.19) 21.379 ms 21.898 ms 21.930 ms 7 209.85.143.37 (209.85.143.37) 29.757 ms 46.183 ms 52.547 ms 8 dns.google (8.8.8.8) 53.694 ms 25.930 ms 25.661 msWith these tests, I think we can safely say that there's something going on with pfsense that's causing the problem. The ISP is not at fault since everything is working properly when I connect the ONU directly to the desktop client, bypassing pfsense.
We also know that the problem isn't the AC66U switch (or any other wired/wireless client connected to it) because the problem also exists using the pfsense diagnostic tools.
With this troubleshooting development, do you have any ideas where to start looking into?
-
@kevindd992002, you can post a screenshot of your dasboard.
-
Mmm, there are only two things I'm aware of that can produce behaviour like that in pfSense.
-
Active traffic shaping.
-
A bug in 21.05 that affected the SG-3100.
-
-
@silence said in Gateway monitor down:
@kevindd992002, you can post a screenshot of your dasboard.
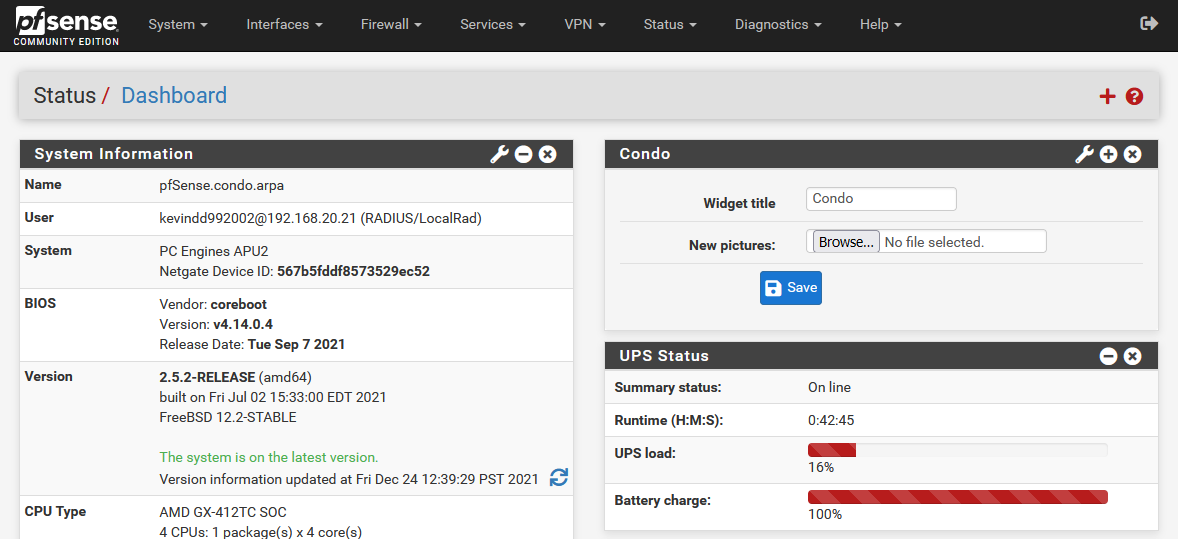
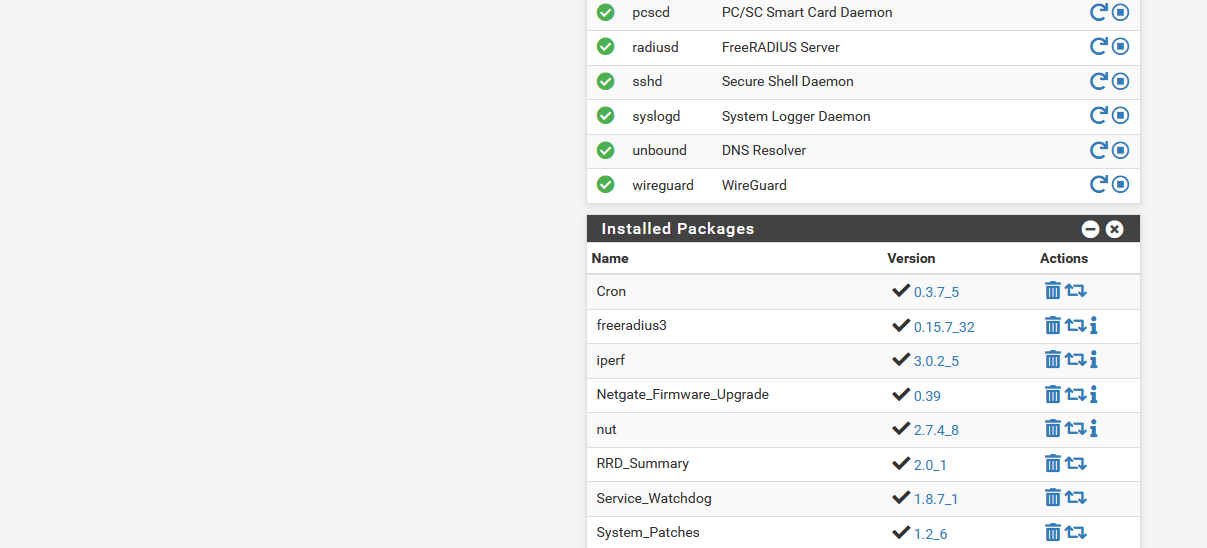
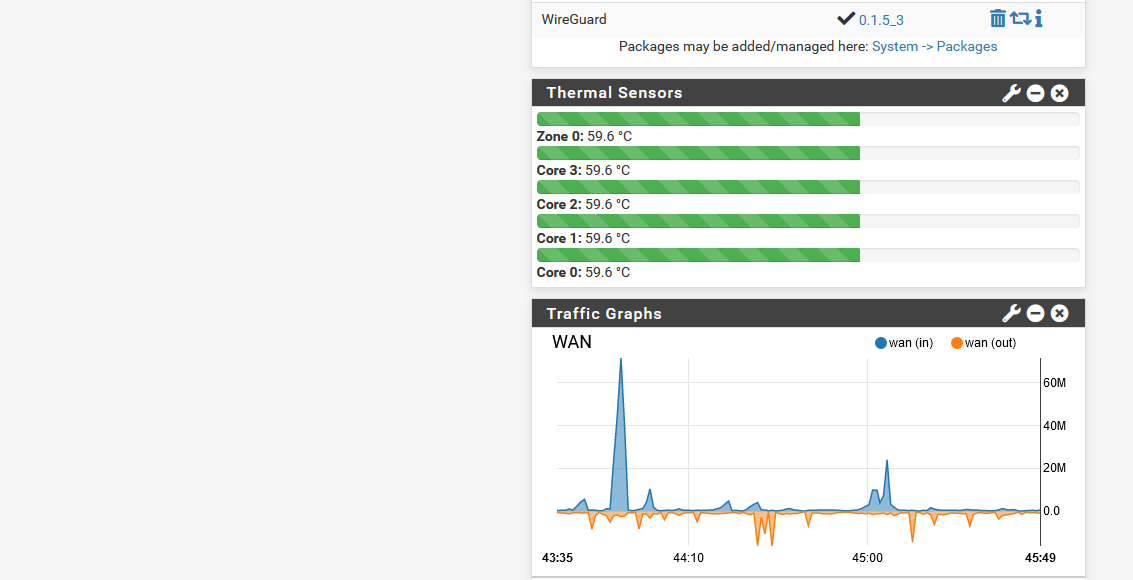
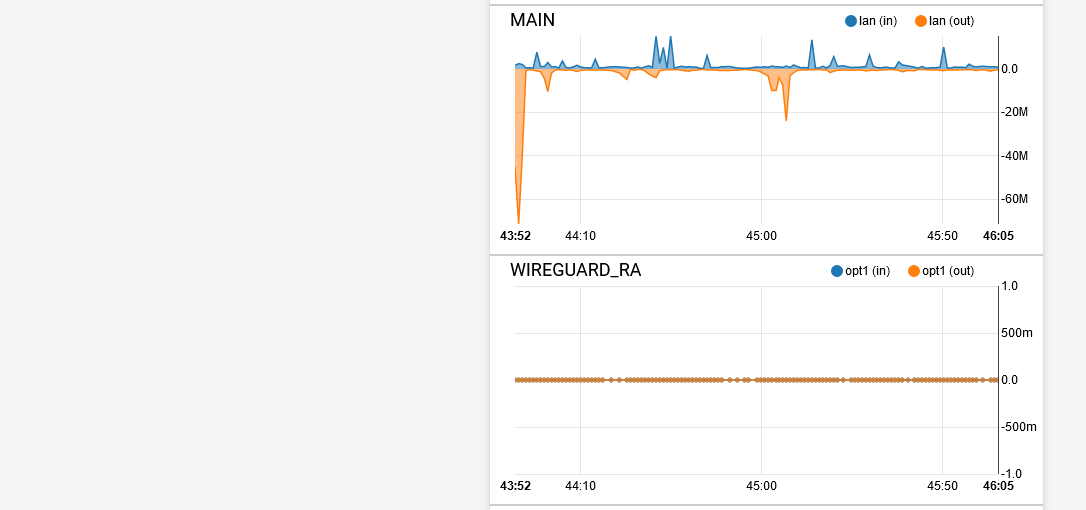
Yes. Here you go:

-
@stephenw10 said in Gateway monitor down:
Mmm, there are only two things I'm aware of that can produce behaviour like that in pfSense.
-
Active traffic shaping.
-
A bug in 21.05 that affected the SG-3100.
I don't have traffic shaper enabled and I also don't have an SG-3100. Additionally, my pfsense box is not anywhere near "heavy load".
-
-
@kevindd992002 said in Gateway monitor down:
Additionally, my pfsense box is not anywhere near "heavy load".
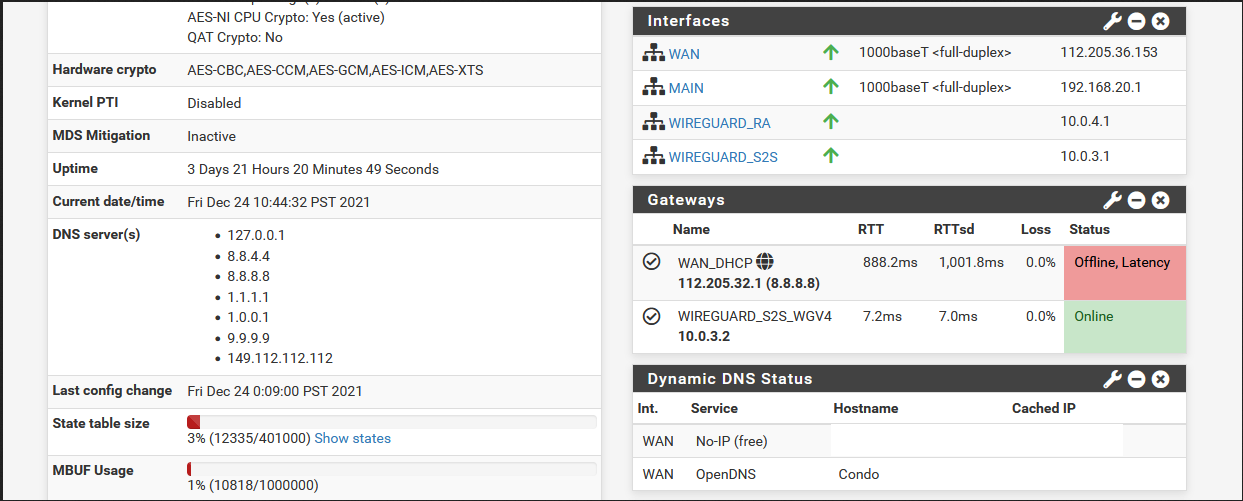
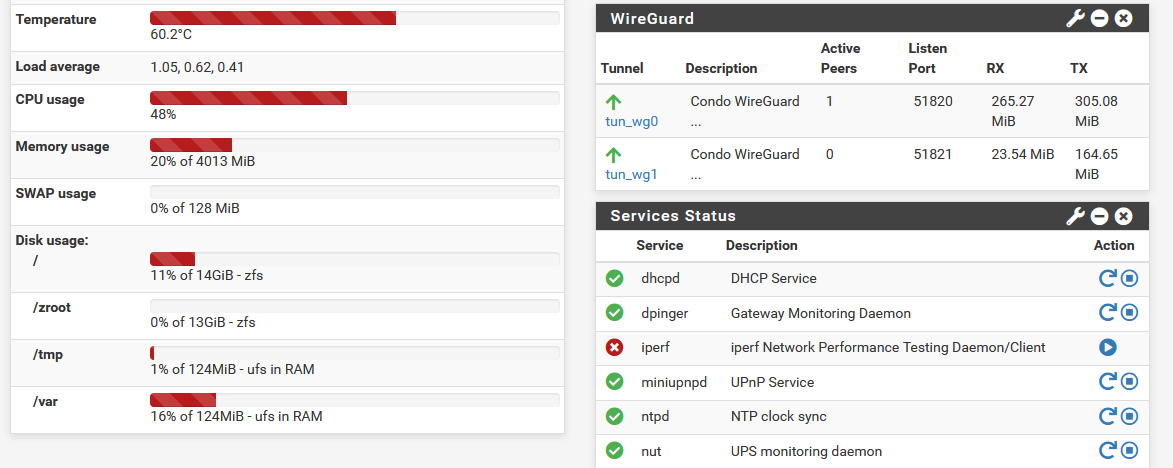
It showing 50% loaded there without passing any significant traffic. What do the monitoring graphs show for processor loading vs latency?
-
@stephenw10 said in Gateway monitor down:
@kevindd992002 said in Gateway monitor down:
Additionally, my pfsense box is not anywhere near "heavy load".
It showing 50% loaded there without passing any significant traffic. What do the monitoring graphs show for processor loading vs latency?
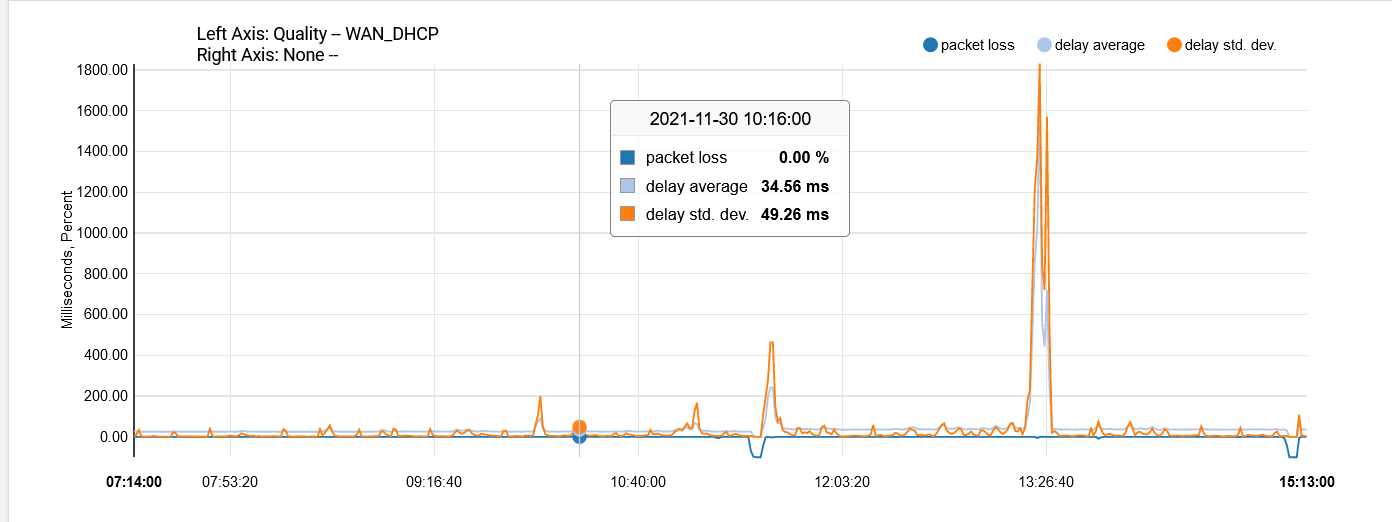
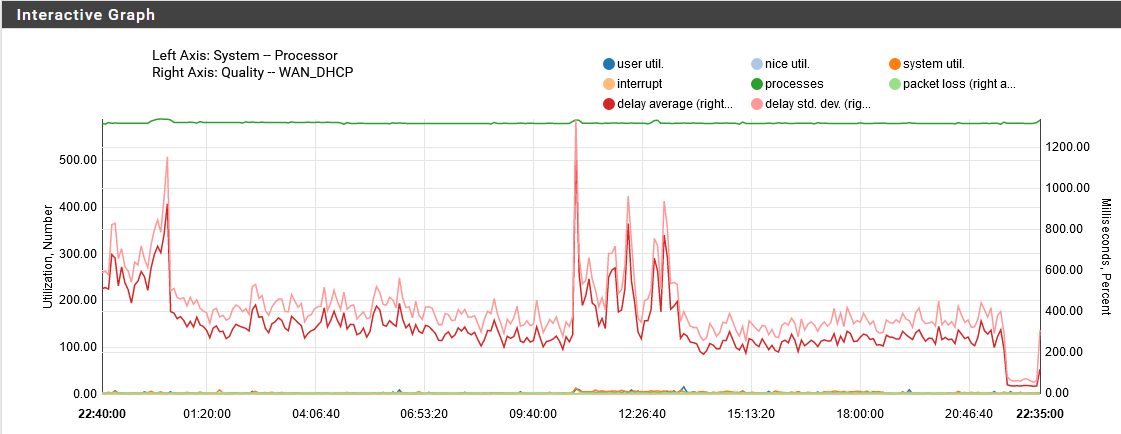
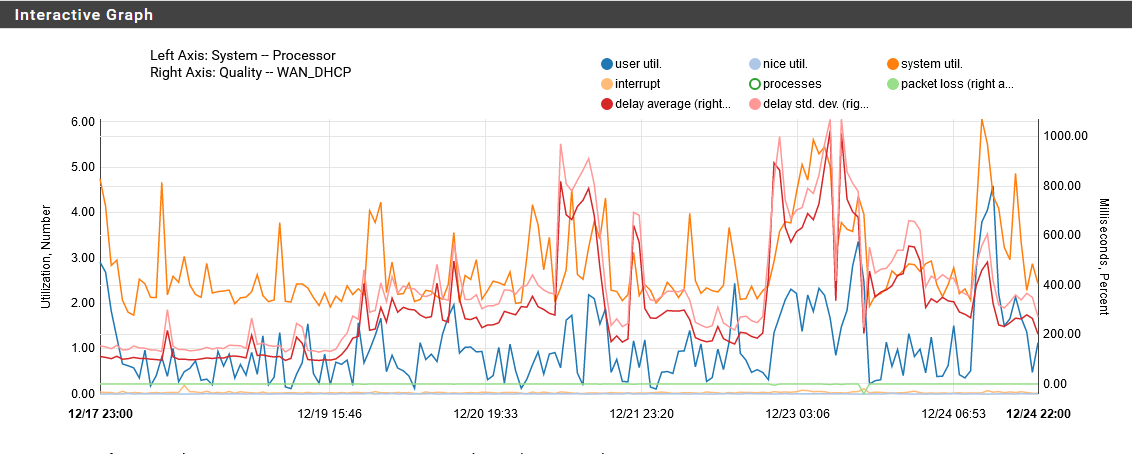
You're right, I didn't notice that in the pictures above. When I checked again just now, it's hovering between 8~11% CPU usage. This is what I see for that graph:
-
Here's a better view:
-
Hmm, well definitely more use when the latency goes up but that could be cause or effect.
This is the same system you used with the previous ISP where you didn't have an issue?
Same Coreboot version? I see you have updated it several times and there have been version that adversely effected throughput.
Steve
-
@stephenw10 said in Gateway monitor down:
Hmm, well definitely more use when the latency goes up but that could be cause or effect.
This is the same system you used with the previous ISP where you didn't have an issue?
Same Coreboot version? I see you have updated it several times and there have been version that adversely effected throughput.
Steve
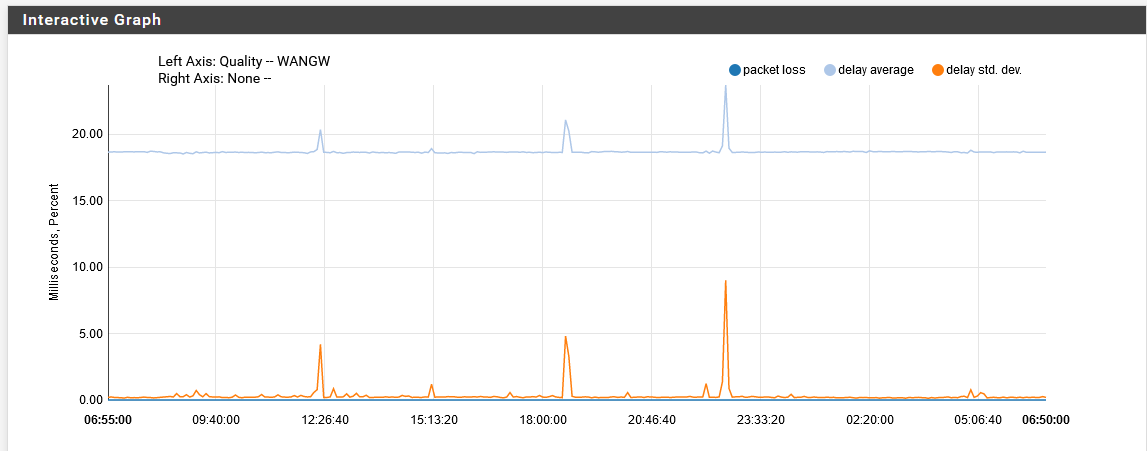
Right. Yes, the same system that I used with my previous ISP that didn't have an issue. And yes, same Coreboot version. In fact, I have another pfsense box (w/ the same Coreboot version) that's still on the previous ISP and no issue.
ping quality to 8.8.4.4 from "other" pfsense box:
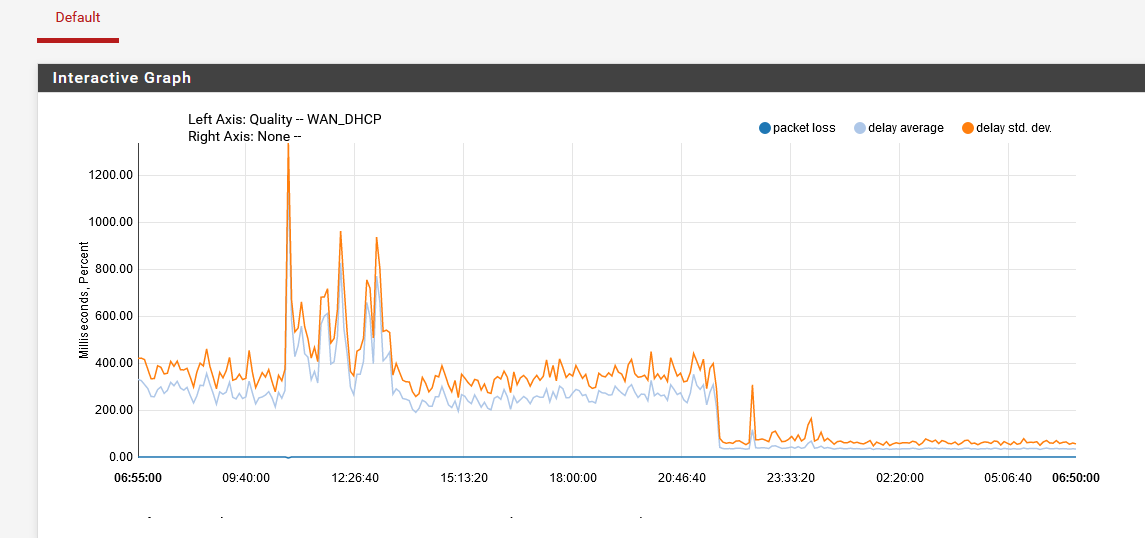
A few hours ago from the affected pfsense box, the ping quality to 8.8.8.8 started coming back down to lower values but still a bit on the high side:
I can try updating to Coreboot to 14.5.0.1 and see if that helps.
-
You could try. I have never used an APU2 so I have no reference there.
-
@kevindd992002 why are you running the pcscd service ?
It may not be helping ... -
That's a good point, you could certainly add the patch disables that.
But usually that causes excess memory use not CPU. -
@hda said in Gateway monitor down:
@kevindd992002 why are you running the pcscd service ?
It may not be helping ...I'm not running it intentionally. It is enabled by default since 2.5.0.
@stephenw10 said in Gateway monitor down:
That's a good point, you could certainly add the patch disables that.
But usually that causes excess memory use not CPU.Thanks. I just added that system patch.
-
@stephenw10 said in Gateway monitor down:
Mmm, there are only two things I'm aware of that can produce behaviour like that in pfSense.
-
Active traffic shaping.
-
A bug in 21.05 that affected the SG-3100.
Is there a system patch to this bug as well?
-
-
It was fixed in 21.05.1. https://docs.netgate.com/pfsense/en/latest/releases/21-05-1.html
It only affected multicore arm32 anyway. It would have been the same on your old ISP.
Steve
-
I see. Since my firewalls are really just for home use (not mission critical), can I just upgrade to the 2.6.x CE dev release to get all the latest updates? I know Christian McDonald is suggesting to do this.
-
Yes, I would do that. I have been running 2.6/22.01 on my primary router her for months now.
Obviously be sure to backup first and have a copy of the 2.5.2 installer on hand anyway.
Steve.
-
@stephenw10 said in Gateway monitor down:
Yes, I would do that. I have been running 2.6/22.01 on my primary router her for months now.
Obviously be sure to backup first and have a copy of the 2.5.2 installer on hand anyway.
Steve.
And when 2.6 stable comes out, can I simply upgrade from dev to latest stable without any issues?
As for the pcscd patch that I just applied, I'm assuming I should just delete the entry after upgrading to dev (without reverting) as jim mentioned here, correct?
-
Yes and yes.
