SG-4860 crashing daily
-
I'm not exactly sure when this started, but I hadn't logged into the UI for a bit and saw the crash reports and downloaded the files.
I'm thinking its related to Wireguard or Tailscale but i'm not 100%.
-
Important parts are:
db:0:kdb.enter.default>  bt
Tracing pid 35301 tid 100294 td 0xfffff8017297e740
kdb_enter() at kdb_enter+0x37/frame 0xfffffe004d3c97d0
vpanic() at vpanic+0x194/frame 0xfffffe004d3c9820
panic() at panic+0x43/frame 0xfffffe004d3c9880
trap_fatal() at trap_fatal+0x38f/frame 0xfffffe004d3c98e0
calltrap() at calltrap+0x8/frame 0xfffffe004d3c98e0
--- trap 0x9, rip = 0xffffffff8120594b, rsp = 0xfffffe004d3c99b0, rbp = 0xfffffe004d3c99c0 ---
vm_radix_remove() at vm_radix_remove+0x1b/frame 0xfffffe004d3c99c0
vm_page_free_prep() at vm_page_free_prep+0x55/frame 0xfffffe004d3c99e0
vm_page_free_toq() at vm_page_free_toq+0x12/frame 0xfffffe004d3c9a10
vm_object_page_remove() at vm_object_page_remove+0x61/frame 0xfffffe004d3c9a70
vm_map_entry_delete() at vm_map_entry_delete+0xff/frame 0xfffffe004d3c9ac0
vm_map_delete() at vm_map_delete+0x184/frame 0xfffffe004d3c9b20
vm_map_remove() at vm_map_remove+0xab/frame 0xfffffe004d3c9b50
vmspace_exit() at vmspace_exit+0xcb/frame 0xfffffe004d3c9b90
exit1() at exit1+0x51c/frame 0xfffffe004d3c9bf0
sys_sys_exit() at sys_sys_exit+0xd/frame 0xfffffe004d3c9c00
amd64_syscall() at amd64_syscall+0x387/frame 0xfffffe004d3c9d30
fast_syscall_common() at fast_syscall_common+0xf8/frame 0xfffffe004d3c9d30
--- syscall (1, FreeBSD ELF64, sys_sys_exit), rip = 0x8003eb74a, rsp = 0x7fffffffeb38, rbp = 0x7fffffffeb50 ---
Fatal trap 9: general protection fault while in kernel mode cpuid = 3; apic id = 06 instruction pointer = 0x20:0xffffffff8120594b stack pointer = 0x28:0xfffffe004d3c99b0 frame pointer = 0x28:0xfffffe004d3c99c0 code segment = base 0x0, limit 0xfffff, type 0x1b = DPL 0, pres 1, long 1, def32 0, gran 1 processor eflags = interrupt enabled, resume, IOPL = 0 current process = 35301 (egrep) trap number = 9 panic: general protection fault cpuid = 3 time = 1659503270 KDB: enter: panicNeither of which point to anything specific unfortunately.
Are the crash reports always identical? Or close to it?
Steve
-
@stephenw10 Thanks for the quick reply. I'm attaching 2 older reports and will collect future ones.
-
One of those appears to be the same file you posted earlier. The other one is different though:
db:0:kdb.enter.default>  bt
Tracing pid 89157 tid 100203 td 0xfffff8017e1a2000
kdb_enter() at kdb_enter+0x37/frame 0xfffffe004cdc4ab0
vpanic() at vpanic+0x194/frame 0xfffffe004cdc4b00
panic() at panic+0x43/frame 0xfffffe004cdc4b60
trap_fatal() at trap_fatal+0x38f/frame 0xfffffe004cdc4bc0
trap_pfault() at trap_pfault+0x4f/frame 0xfffffe004cdc4c20
trap() at trap+0x425/frame 0xfffffe004cdc4d30
calltrap() at calltrap+0x8/frame 0xfffffe004cdc4d30
--- trap 0xc, rip = 0x8004ed10c, rsp = 0x7fffdfffdd60, rbp = 0x7fffdfffddc0 ---
Fatal trap 12: page fault while in user mode cpuid = 2; apic id = 04 fault virtual address = 0x800a008c8 fault code = user read data, reserved bits in PTE instruction pointer = 0x43:0x8004ed10c stack pointer = 0x3b:0x7fffdfffdd60 frame pointer = 0x3b:0x7fffdfffddc0 code segment = base 0x0, limit 0xfffff, type 0x1b = DPL 3, pres 1, long 1, def32 0, gran 1 processor eflags = interrupt enabled, resume, IOPL = 0 current process = 89157 (charon) trap number = 12 panic: page fault cpuid = 2 time = 1659406768 KDB: enter: panicVery different crash reports like that starts to look like a hardware issue.
You think this started happening after installing Wireguard?
Or after upgrading to 22.05 maybe?
Steve
-
@stephenw10 I found some more crash logs that I had sent to myself over Telegram. Hopefully these might shed some light.
-
Mmm, those are all different. That is looking more like a memory fault unfortunately.
Are you able to try a clean install of 22.05?
Steve
-
@stephenw10 This is currently the production firewall for this location. I purchased a XG-1537 last year and a stack of new switches to install but haven't scheduled a time to replace it all.
I'll try to reload the 4860 after everything stabilizes.
Last nights crash dump.
textdump.tar.0 -
Mmm, another similar crash but different panic. Again it doesn't point to any specific thing and looks increasingly like a hardware issue unfortunately.
Steve
-
@stephenw10 The device hadn't crashed in a few days, but this morning it has a PHP crash log as well.
[12-Aug-2022 00:42:00 UTC] PHP Warning: Static function mbereg_search() cannot be abstract in Unknown on line 0 -
Hmm, that looks different, more like it just ran out of memory.
That also ties in with this:
<6>pid 71216 (unbound), jid 0, uid 59: exited on signal 11If you check the monitoring graphs in Status > Monitoring do you see memory usage increasing with time?
-
@stephenw10 I checked the memory graph for a 2 day period with 5 min resolution and didn't see the free memory decrease except during the crashes.
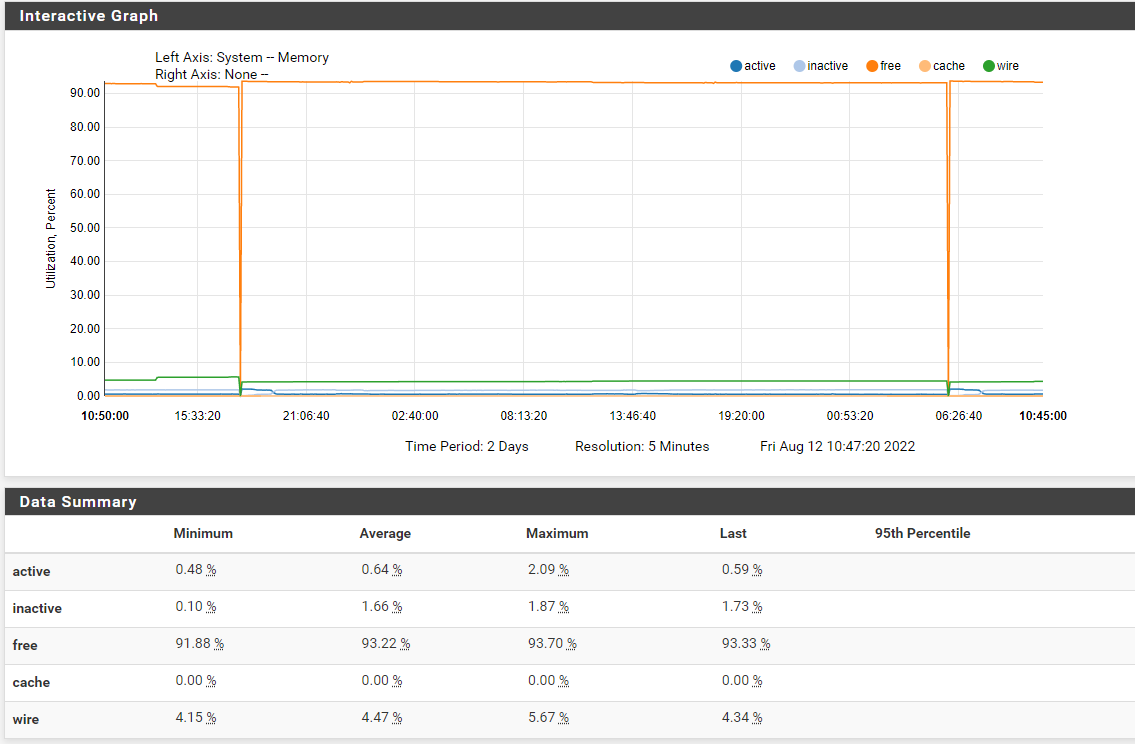
I'll keep a watch for anything new.
-
Mmm, I agree, it doesn't look like it's exhausting the memory directly.
-
@stephenw10 I believe I have narrowed the issue down to the tailscale package. I noticed when I came back from vacation that the firewall had been up over 8 days w/o a crash.
Checking the logs showed that either PHP or PHP-CGI was exiting on signal 11 with a core dump, and the services section showed that tailscale wasn't running either.
On a hunch I started the tailscale service yesterday morning to see if a crash would happen. Sure enough, last night it crashed again.
Attached is the latest dump. textdump.tar.0
-
So you had disabled tailscale while you were away? Or it had stopped by itself and then crashed after you restarted it?
Steve
-
@stephenw10 tailscale had crashed apparently, but the connections it made we're still running so I didn't notice the service itself was down.
I restarted the service yesterday morning to see if it was the cause of the crashes, then this morning when I logged in, I saw the crash report.
-
Mmm, not familiar to me. Let me see if any one else has seen it....