High CPU load on single CPU core
-
Hi All
We have been seeing a very weird issue on our pfsense box where we see WAN latency (1Gbit WAN) going up from 0.7ms to over 100ms at times. While this occurs I noticed that there is one single CPU core maxed out throughout.
In htop no command shows up that is maxing out the CPU, but when looking at SYSTEM ACTIVITY in the pfsense UI we can see this:
  PID USERNAME    PRI NICE   SIZE    RES STATE    C   TIME    WCPU COMMAND
    0 root        -76    -     0B  1184K CPU1     1 868:11  99.76% [kernel{if_io_tqg_1}]
Which matches with our maxed out CPU core:
last pid: 39007;  load averages:  2.01,  1.96,  1.99                                                                                                                                up 0+16:58:19  22:36:57
67 processes:  3 running, 64 sleeping
CPU 0:  8.6% user,  0.0% nice,  1.2% system,  0.0% interrupt, 90.2% idle
CPU 1:  0.0% user,  0.0% nice,  100% system,  0.0% interrupt,  0.0% idle
CPU 2:  6.9% user,  0.0% nice,  1.2% system,  0.0% interrupt, 91.9% idle
CPU 3:  0.0% user,  0.0% nice,  0.8% system,  6.3% interrupt, 93.0% idle
CPU 4:  0.4% user,  0.0% nice,  0.0% system,  0.0% interrupt, 99.6% idle
CPU 5:  0.4% user,  0.0% nice,  0.8% system,  0.0% interrupt, 98.8% idle
CPU 6:  2.0% user,  0.0% nice,  2.0% system,  0.0% interrupt, 96.1% idle
CPU 7:  0.0% user,  0.0% nice, 22.7% system,  0.0% interrupt, 77.3% idle
Does anyone know what
if_io_tqg_1is and what we might need to do to further diagnose whats going on?PfSense Specs:
CPU: Intel(R) Atom(TM) CPU C3758 @ 2.20GHz Ram: 32GB NICs: Ethernet Connection X553 1GbE Wan uplink: 1Gbit Approx traffic via wan: 200Mbit -
@yswery said in High CPU load on single CPU core:
Does anyone know what if_io_tqg_1 is and what we might need to do to further diagnose whats going on?
That represents network queue handlers. Found some related posts for you, but no real solutions.
https://forum.netgate.com/topic/173523/what-is-kernel-if_io_tqq_x
https://forums.freebsd.org/threads/what-is-kernel-if_io_tqg-100-load-of-core.70642/
-
Mmm, that is where the load from pf itself appears. 100% of one CPU core on a C3758 is a lot for 200Mbps though. And pf loading would normally be spread across queues/cores unless the NICs are being deliberately limited to one queue.
Steve
-
@stephenw10 said in High CPU load on single CPU core:
Mmm, that is where the load from pf itself appears. 100% of one CPU core on a C3758 is a lot for 200Mbps though. And pf loading would normally be spread across queues/cores unless the NICs are being deliberately limited to one queue.
Steve
Do you have any idea or hint where I might be able to see if there is any (accidental?) setting to use only one core per NIC?
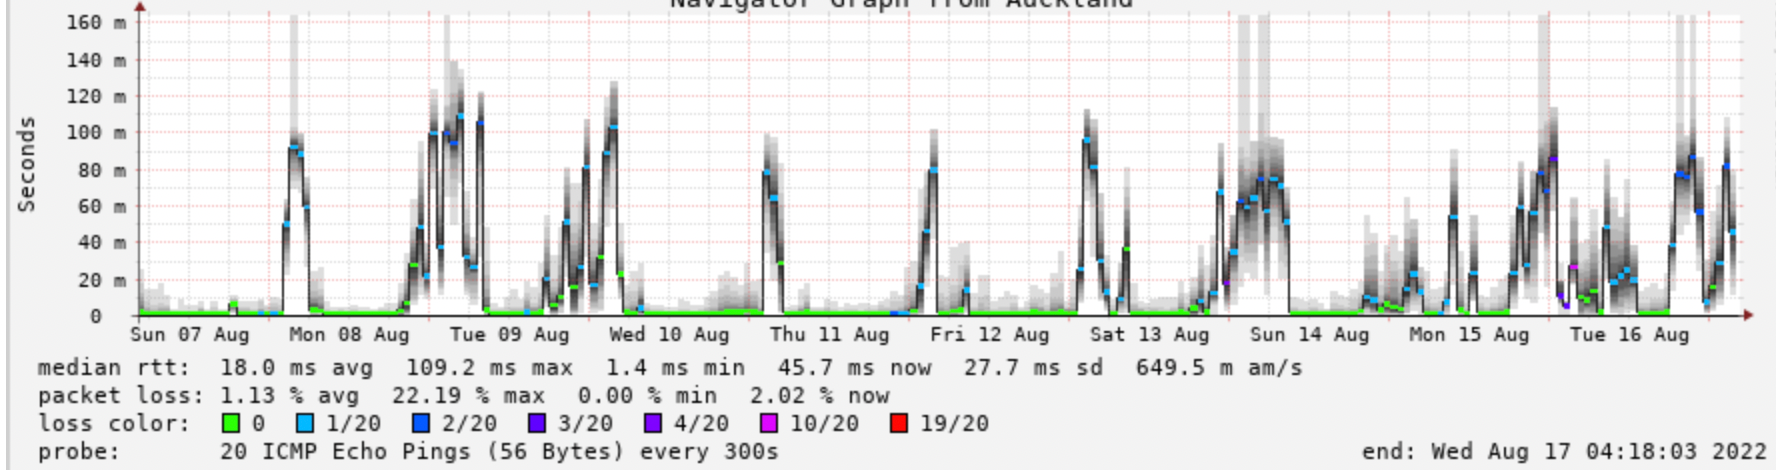
While this occurs (which is more and more frequently in the past 2 weeks for us) we are seeing these spikes in latency and packet loss to our (directly connected) upstream.
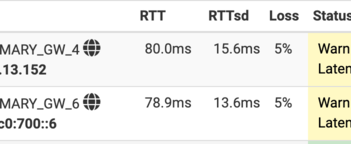 When this issue isnt occurring we usually see under 1ms latency
Is there a way to see what type of traffic is trigging this CPU use?
The reason why I think its a "certain type of traffic" is because we sometimes see 200Mbps (or more if we run speedtests) without any issues at allHere is an example of (external) monitoring
-
What pfSense version are you running?
Easiest way to check the NIC queues is usually the boot log. You should see something like:
ix0: <Intel(R) X553 N (SFP+)> mem 0x80400000-0x805fffff,0x80604000-0x80607fff at device 0.0 on pci9
ix0: Using 2048 TX descriptors and 2048 RX descriptors
ix0: Using 4 RX queues 4 TX queues
Steve
-
@stephenw10 said in High CPU load on single CPU core:
Easiest way to check the NIC queues is usually the boot log. You should see something like:
Oh interesting, this is what I see:
$ cat /var/log/dmesg.boot | grep ix3
ix3: <Intel(R) X553 (1GbE)> mem 0xdd200000-0xdd3fffff,0xdd600000-0xdd603fff at device 0.1 on pci7
ix3: Using 2048 TX descriptors and 2048 RX descriptors
ix3: Using an MSI interrupt
ix3: allocated for 1 queues
ix3: allocated for 1 rx queues
ix3: Ethernet address: ac:1f:6b:b1:d8:af
ix3: eTrack 0x8000087c
ix3: netmap queues/slots: TX 1/2048, RX 1/2048
ix3 being the WAN interface, but all 4 ixN devices are all showing "allocated for 1 queues"
This is pfsense 2.6 CE but this box is a few years old from v2.4 days and has been incrementally updated. (so might have some settings it now should not)
-
Ah, maybe you have set queues to 1 in /boot/loader.conf.local?
That was a common tweak back in the FreeBSD 10 (or was it 8?) era when multiqueue drivers could prove unstable.
But those should be at least 4 queues.
I would still have expected it to pass far more though even with single queue NICs. But that does explain why you are seeing the load on one core.
Steve
-
So I just removed a bunch of older configs now this is what I see:
ix3: <Intel(R) X553 (1GbE)> mem 0xdd200000-0xdd3fffff,0xdd600000-0xdd603fff at device 0.1 on pci7
ix3: Using 2048 TX descriptors and 2048 RX descriptors
ix3: Using 8 RX queues 8 TX queues
ix3: Using MSI-X interrupts with 9 vectors
ix3: allocated for 8 queues
ix3: allocated for 8 rx queues
And holy wow, things are running beautifully (for now)
What even more crazy, is when the network is under-utilised we WERE getting ~0.7ms to our transit provider, and now we're seeing 0.3ms stable (and staying at 0.3ms under our regular 200mbit load)
I might be counting the chickens before the hatch, but this change alone seems to have made a dramatic improvement (better than we have recorded in our historic smokepings for the past 2 years even)
Thanks pointing this out!
-
Nice.

-
@stephenw10
Hi,
I was looking at my own loader.conf since i didn't have the loader.conf.localIs this normal?
kern.cam.boot_delay=10000
kern.ipc.nmbclusters="1000000"
kern.ipc.nmbjumbop="524288"
kern.ipc.nmbjumbo9="524288"
opensolaris_load="YES"
zfs_load="YES"
kern.geom.label.gptid.enable="0"
kern.geom.label.disk_ident.enable="0"
kern.geom.label.disk_ident.enable="0"
kern.geom.label.gptid.enable="0"
opensolaris_load="YES"
zfs_load="YES"
net.link.ifqmaxlen="128"
net.link.ifqmaxlen="128"
net.link.ifqmaxlen="128"
net.link.ifqmaxlen="128"
net.link.ifqmaxlen="128"
net.link.ifqmaxlen="128"
net.link.ifqmaxlen="128"
net.link.ifqmaxlen="128"
net.link.ifqmaxlen="128"
net.link.ifqmaxlen="128"
net.link.ifqmaxlen="128"
net.link.ifqmaxlen="128"
net.link.ifqmaxlen="128"
net.link.ifqmaxlen="128"
net.link.ifqmaxlen="128"
net.link.ifqmaxlen="128"
net.link.ifqmaxlen="128"
net.link.ifqmaxlen="128"
autoboot_delay="3"
hw.hn.vf_transparent="0"
hw.hn.use_if_start="1"
net.link.ifqmaxlen="128"
Why so many "net.link.ifqmaxlen="128"
And some other double lines too--- 25.07.1 ---
Intel(R) Xeon(R) CPU D-1518 @ 2.20GHz
Kingston DDR4 2666MHz 16GB ECC
2 x HyperX Fury SSD 120GB (ZFS-mirror)
2 x Intel i210 (ports)
4 x Intel i350 (ports) -
@moonknight I get those double lines as well. It’s really weird!
-
@moonknight said in High CPU load on single CPU core:
Why so many "net.link.ifqmaxlen="128"
Your machine is stuttering ...
 (joke)
 -
It's a known issue but it's only cosmetic. The duplicate entries don't hurt anything.
Steve