23.1 using more RAM
-
Yeah, that looks like a bug in telegraf to me. No way it should ever use that much memory. You config doesn't seem particularly exotic.
Yeah it would be good to know if it immediately uses a lot of memory or if if ramps up from a reasonable amount indicating a memory leak.
Steve
-
@stephenw10 Looks like it is a memory leak. I let it run for about 8 hours thus far, Then I started watching it and seen it was running a little higher around 65% and as I was tying a response to you, I looked over and it slowly ramped up to 94% with telegraf disabled. So what you need from me to help identify this memory leak or what do I do in this situatin to help get this resolved?
-
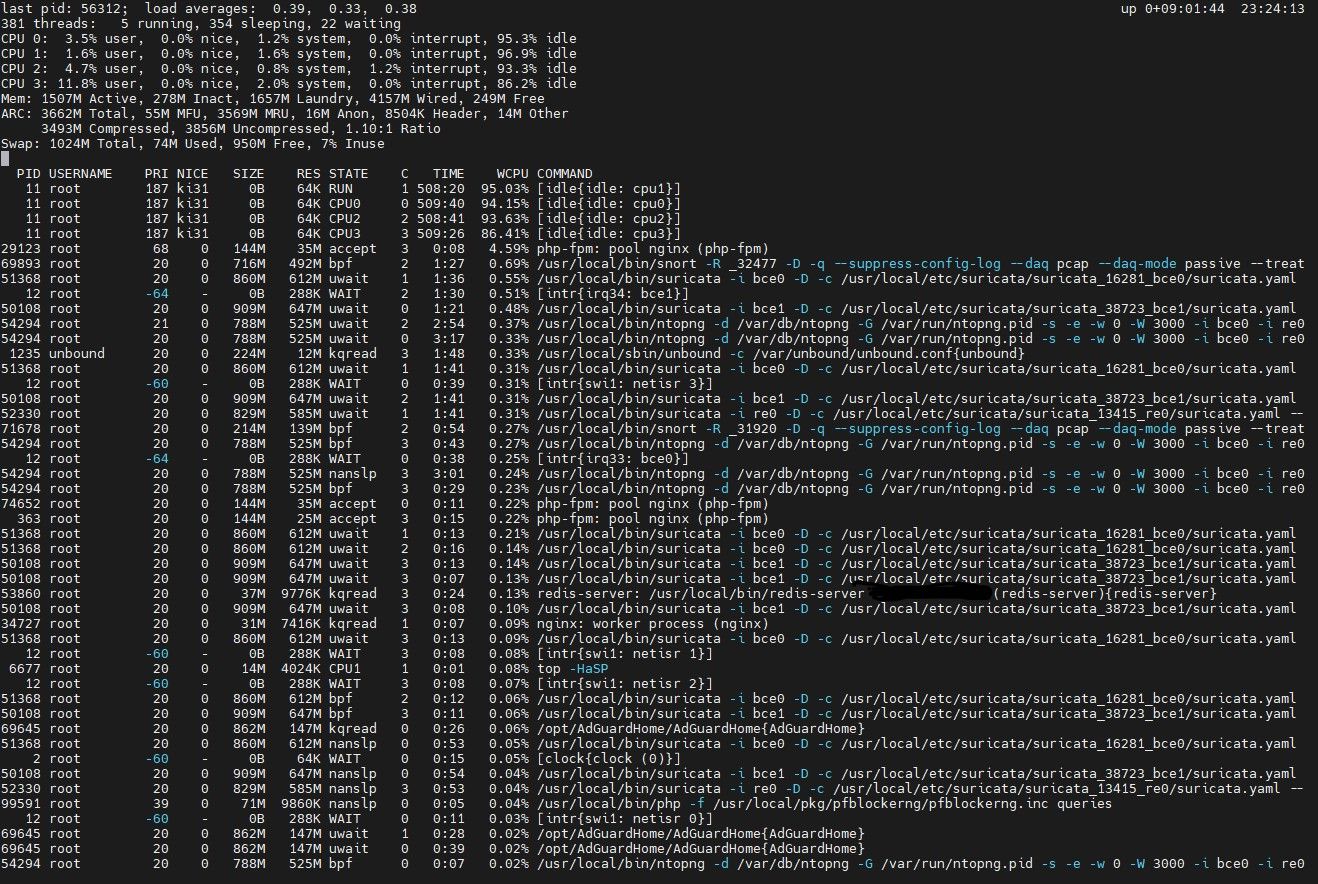
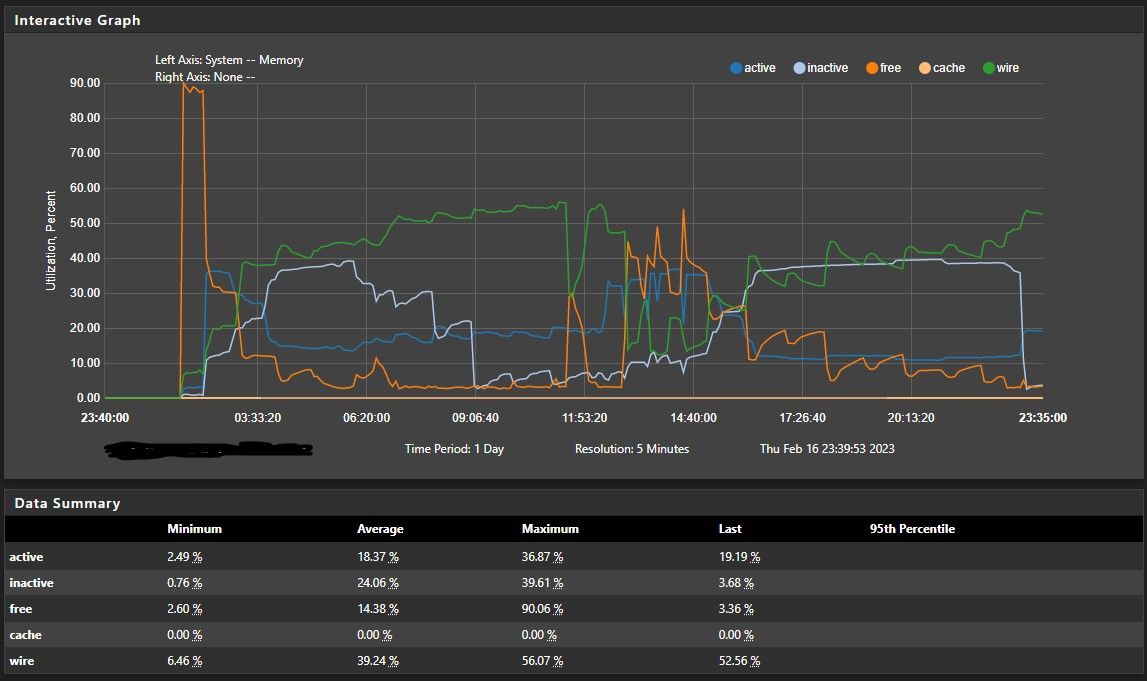
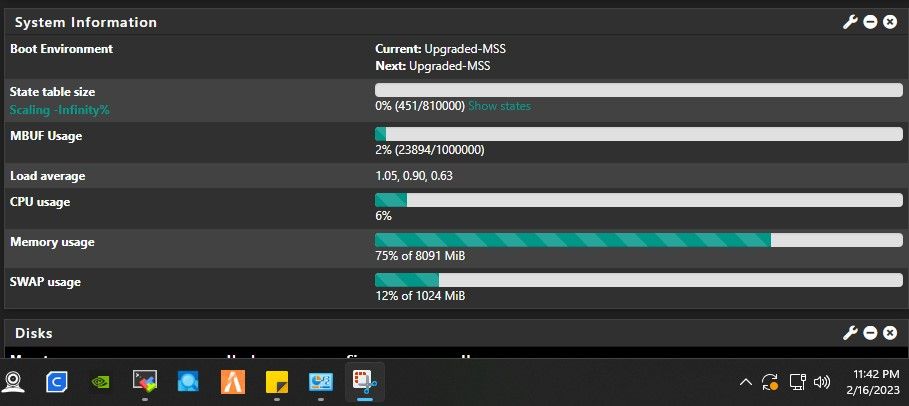
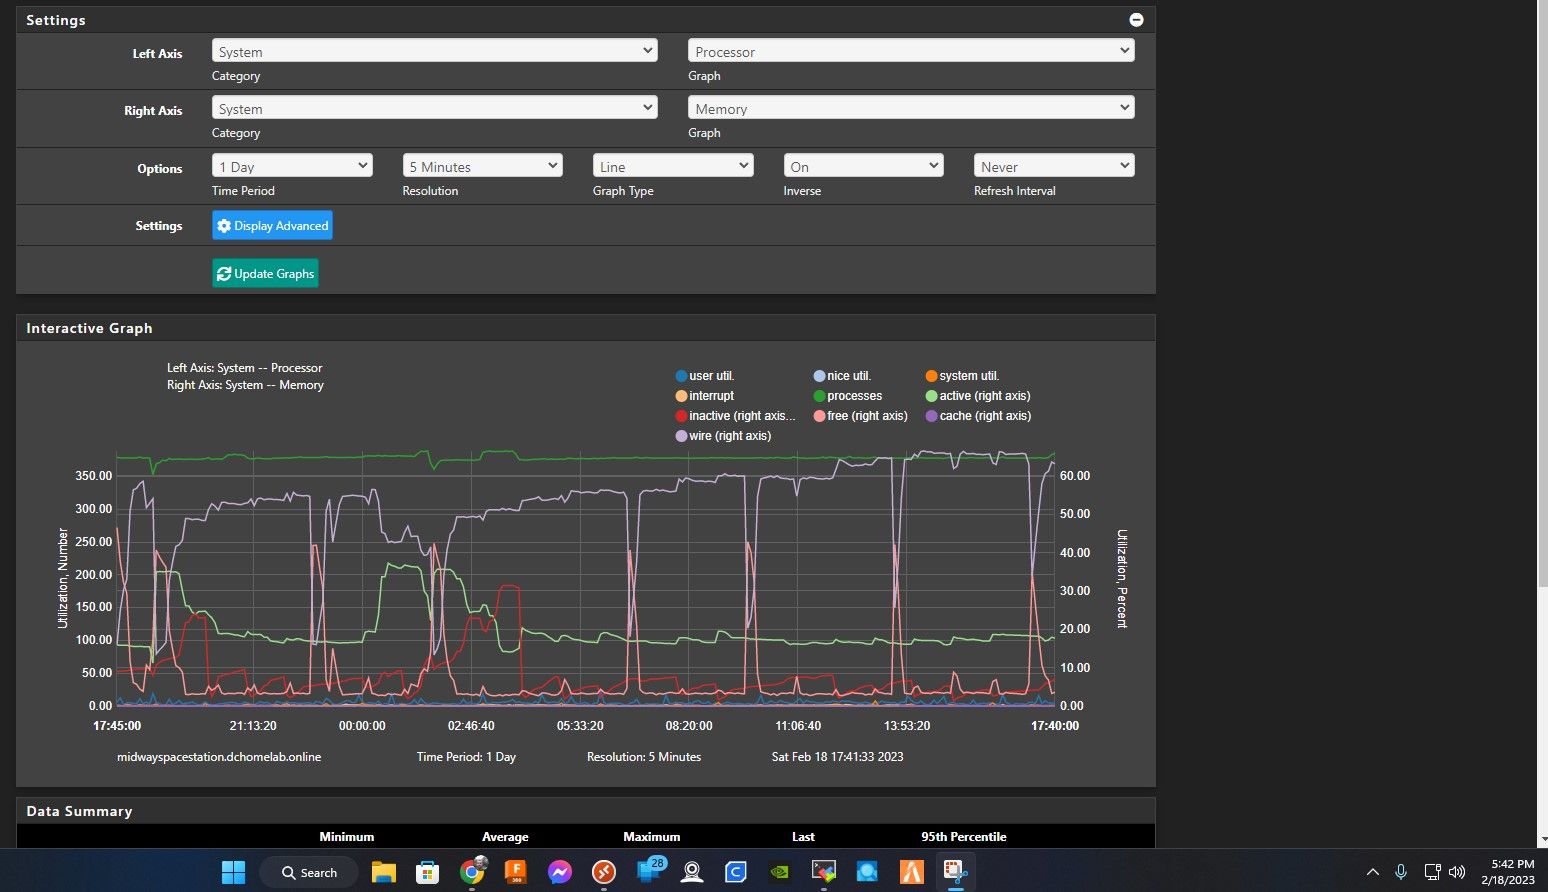
@stephenw10 I took some more screen shots, The memory went down to 75%, and SWAP usage went up to 12%, I took another screen shot of top -HaSP to show you. and a memory graph.
-
This post is deleted! -
This post is deleted! -
Hmm, what happened in that last hour that used all the inactive RAM?
What does the memory usage in top look like immediately after booting into 23.01.
It's not obvious which of those processes has increased it's memory usage. -
When watching
top, usetop -aS -o resto sort by theREScolumn and without some of the extra CPU info that isn't relevant to memory usage.In a couple of your
topoutputs the ZFS ARC usage is pretty high (Almost 4GB in one of them) which would correspond to some of the Wired usage. ZFS will give up ARC memory is needed if something else needs it, though, it just looks worse than it really is. -
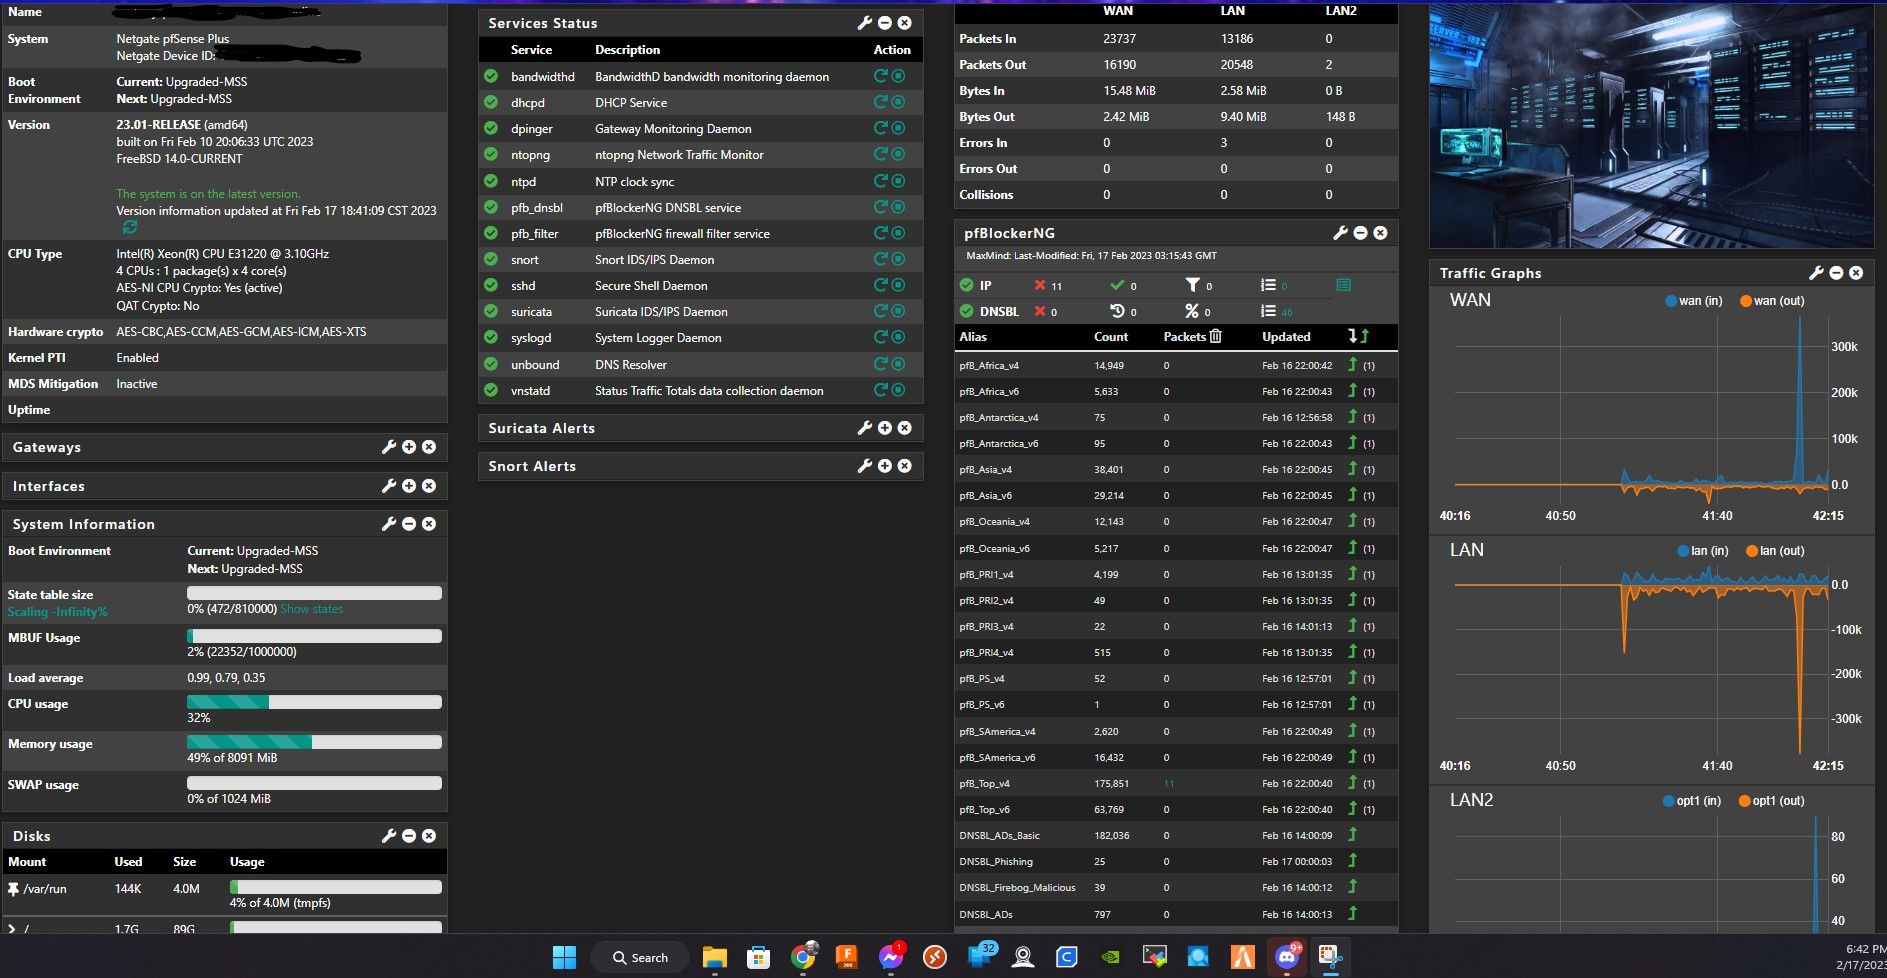 @stephenw10 I have no clue what happened ;-) it's as if after 8 - 9 hours of uptime the memory usage starts to increase over time which sounds like a memory leak to me.
I had to delete the comment I made prior to you posting this statement not realizing I forgot to hide my IP and your site wont allow me to edit MY post after some arbitrary time limit to repost the same screenshot with my IP blocked out:

So I'll repost it here to show overtime what I'm seeing with the memory usage!
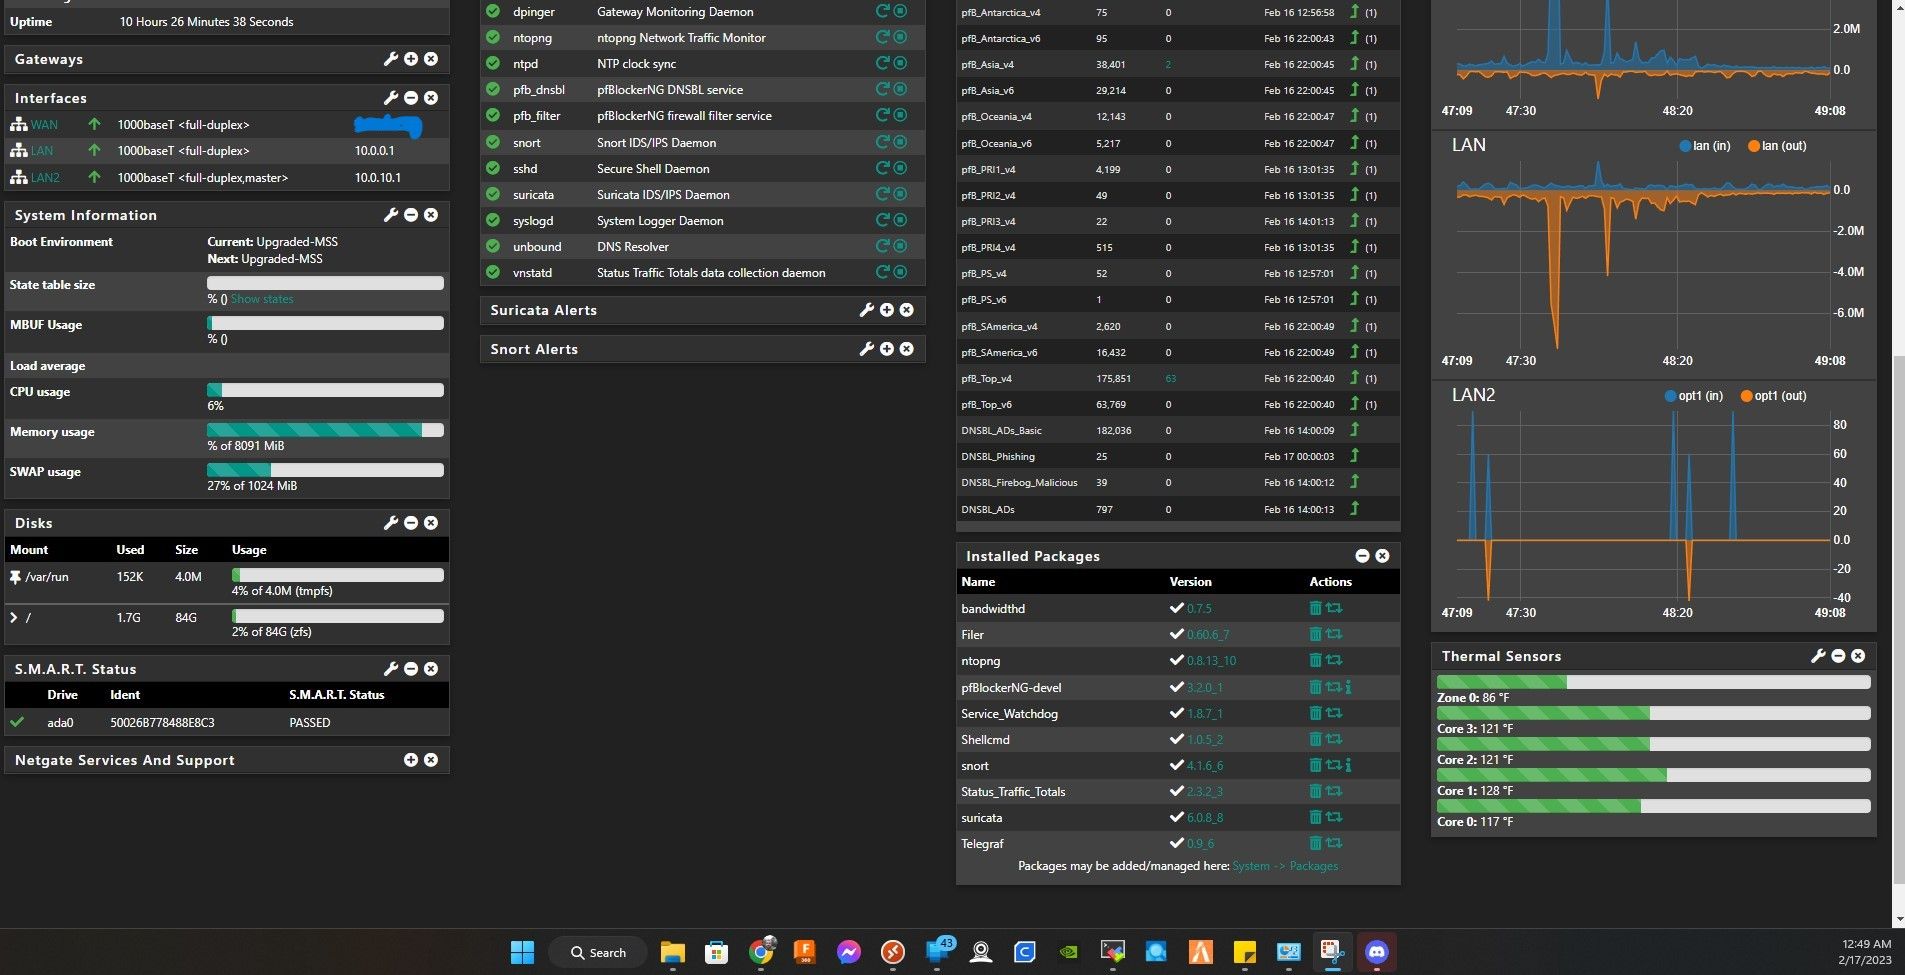
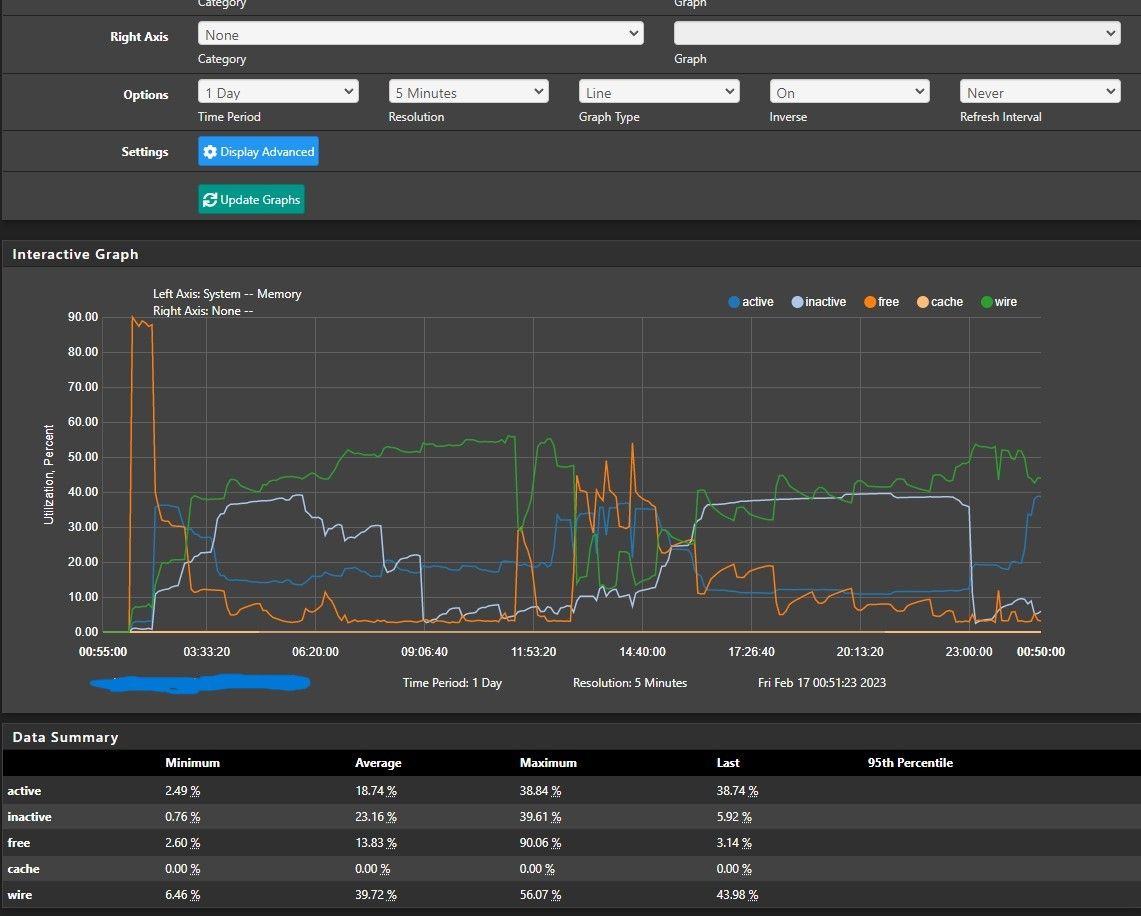
I had restarted it after taking those screenshots and the memory usage went back to normal. And again I had little network activity when taking those screen shots. Then 12+ hours later I take another look and see this:
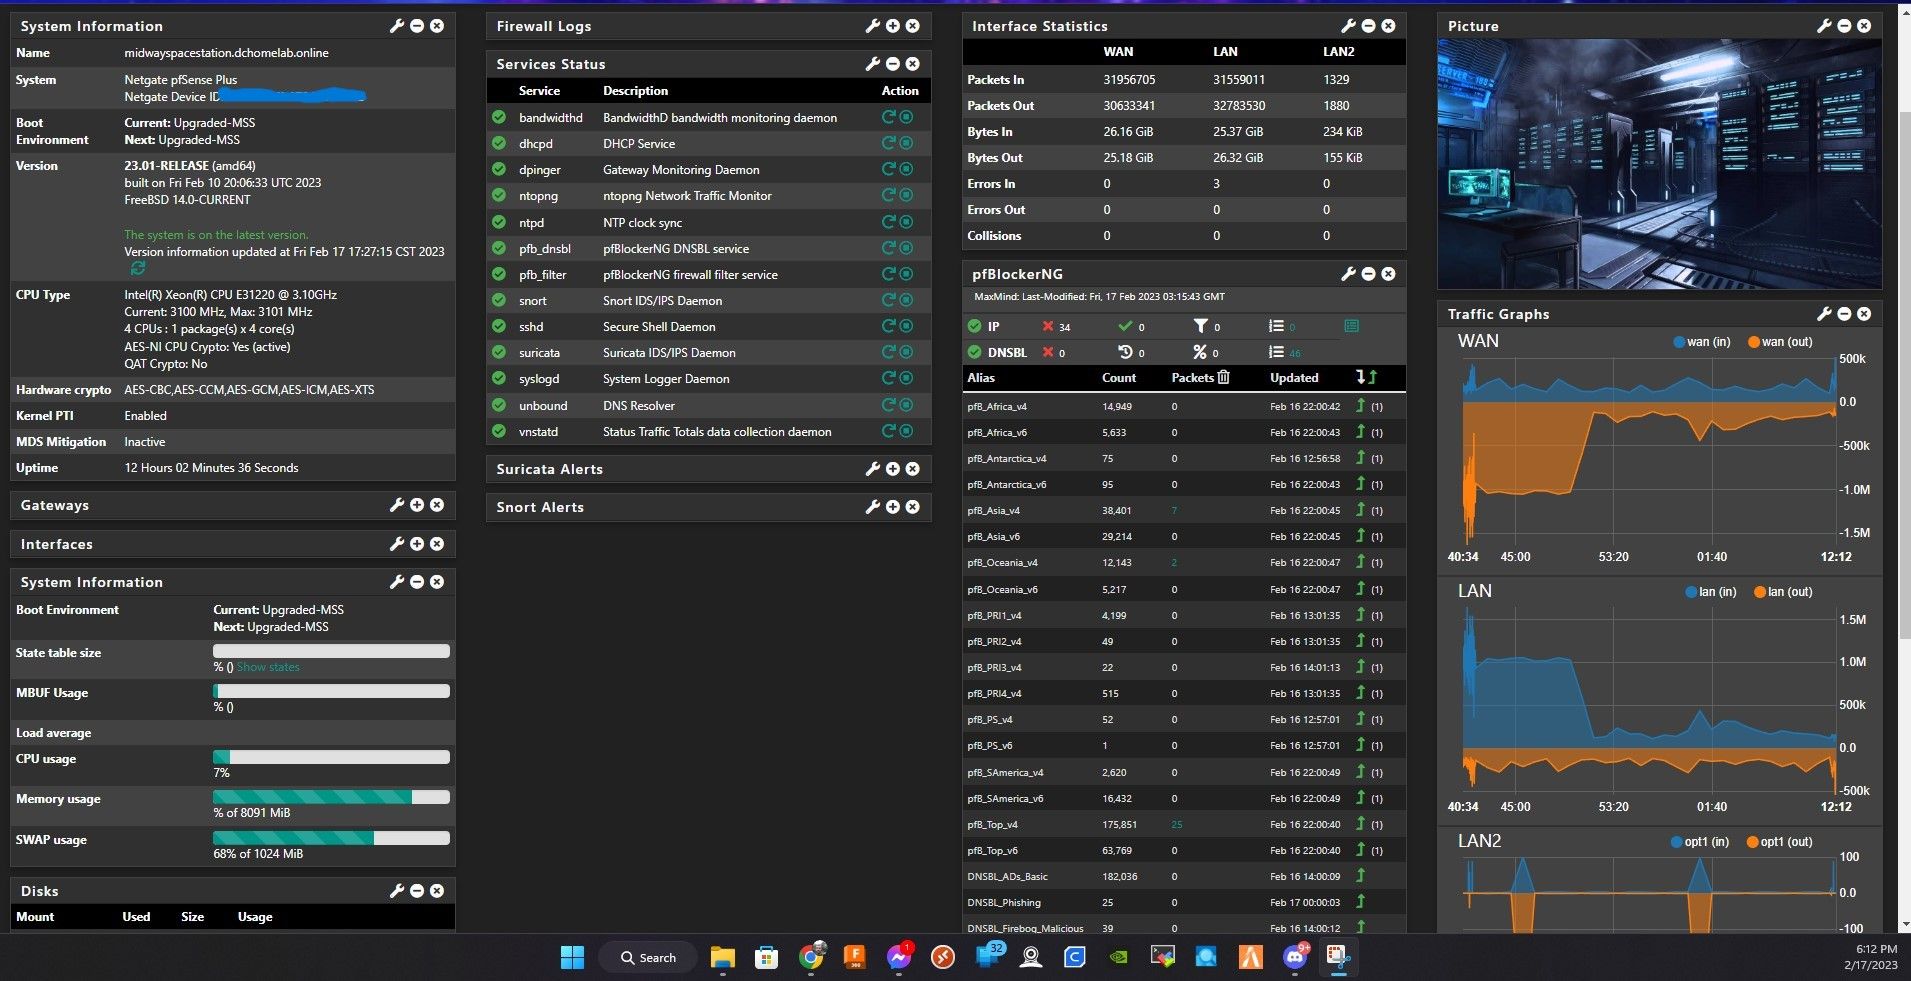
I restart again and see this:

-
@jimp kk, I had just restart it before reading this and posting my last screenshots. I'll let it run a bit and when I see memory usage start to increases I'll follow your recomendation.
-
@jimp This is about 2 hours later, So I guess I was wrong earlier when I stated it appears memory increasing after about 8 hours of uptime.
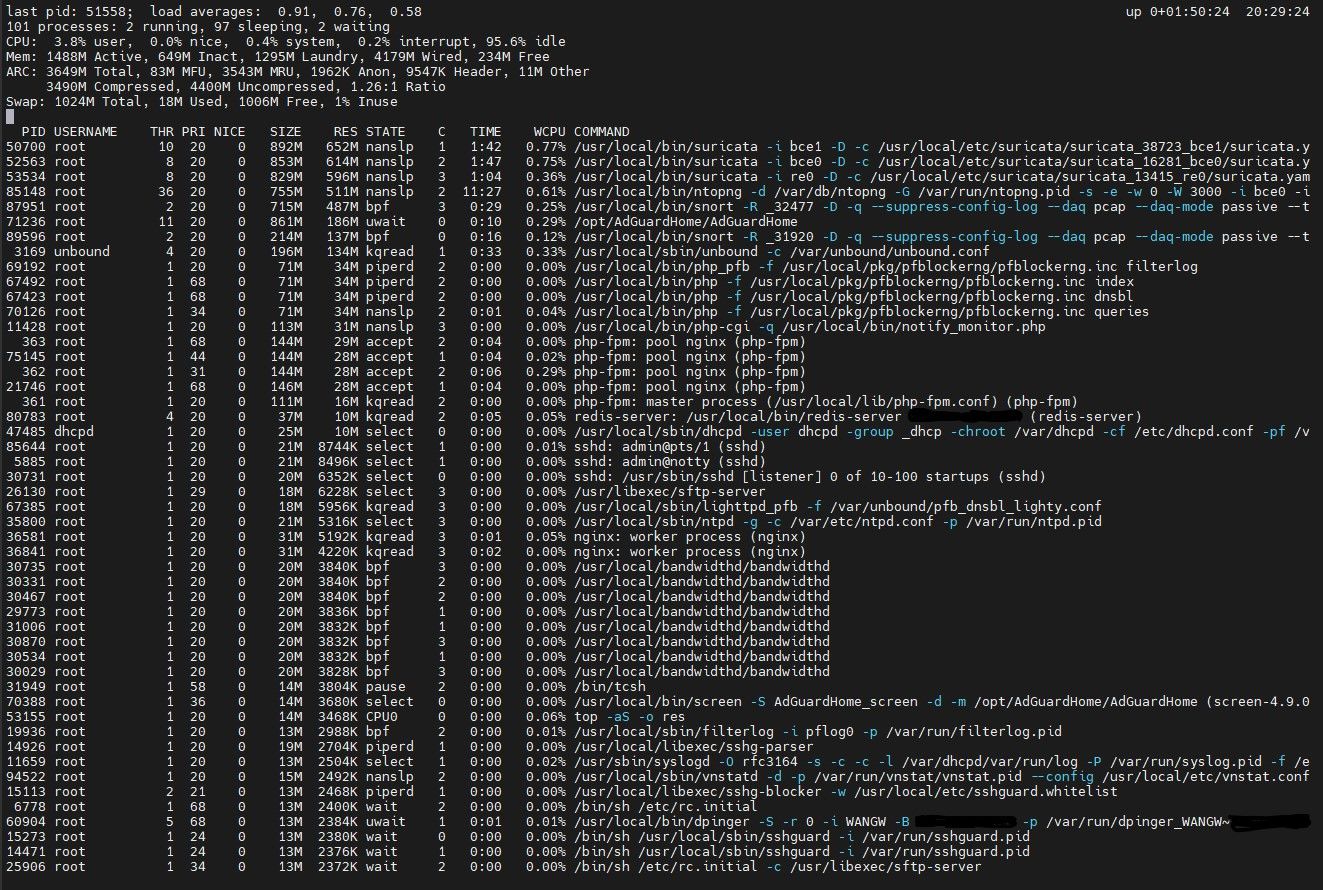
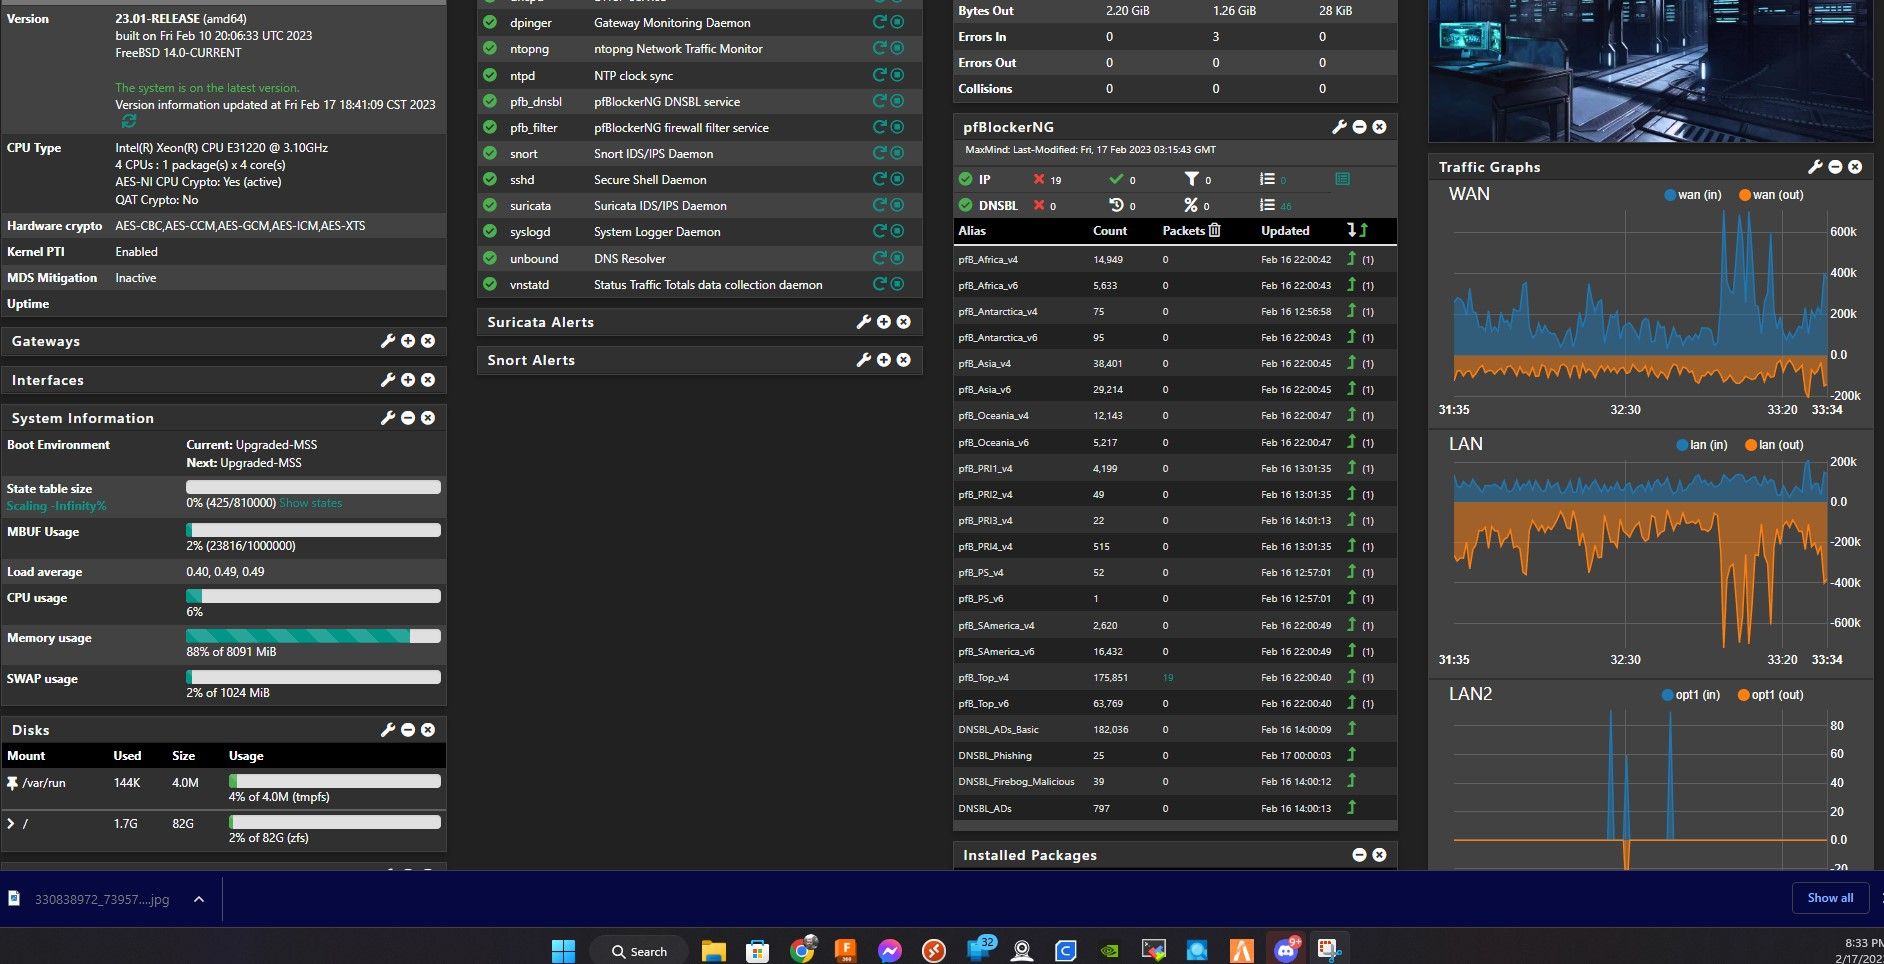
-
This post is deleted! -
@jimp Here's about 6 hours after the last two screenshots I posted.
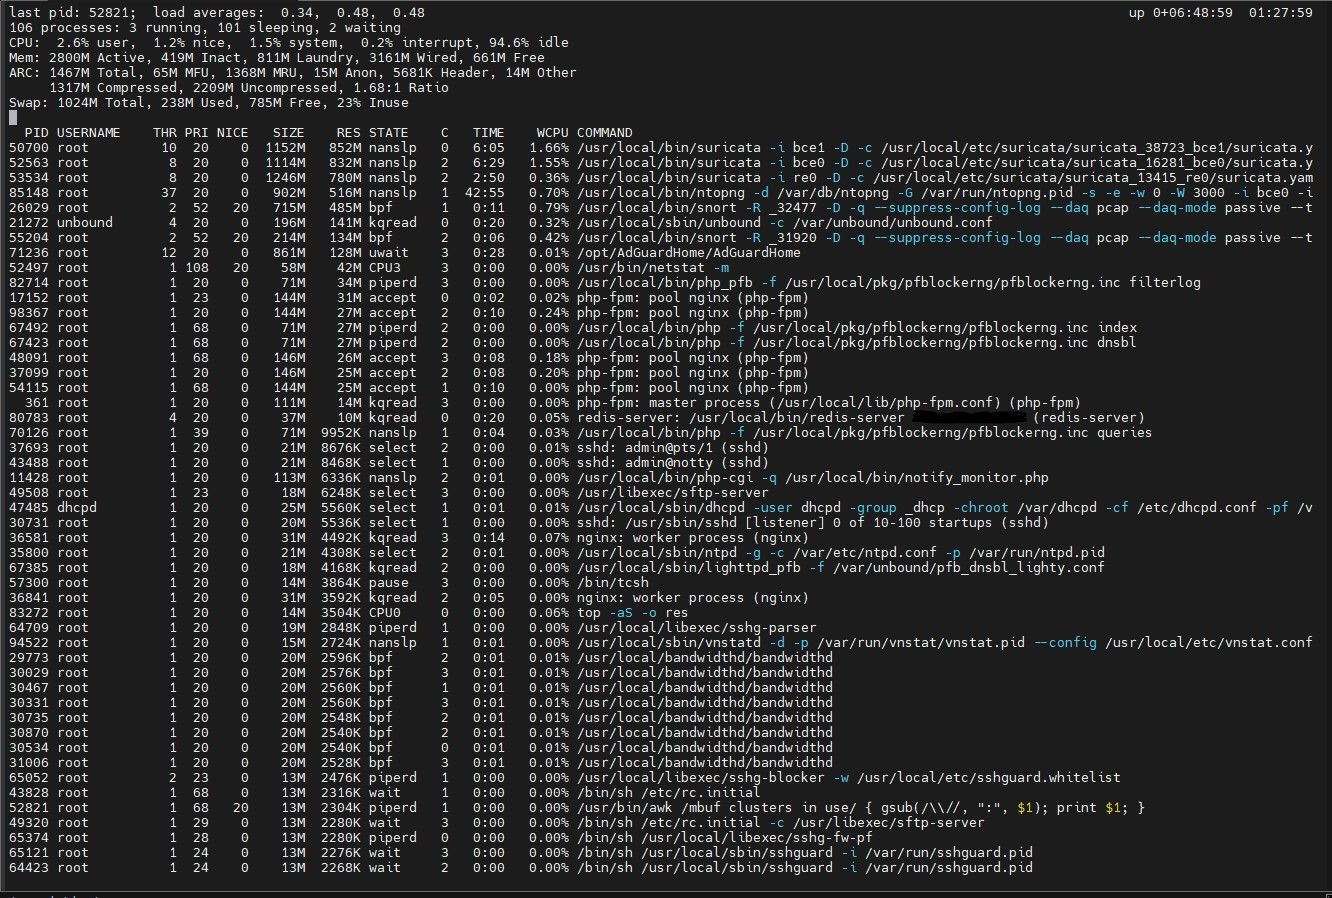
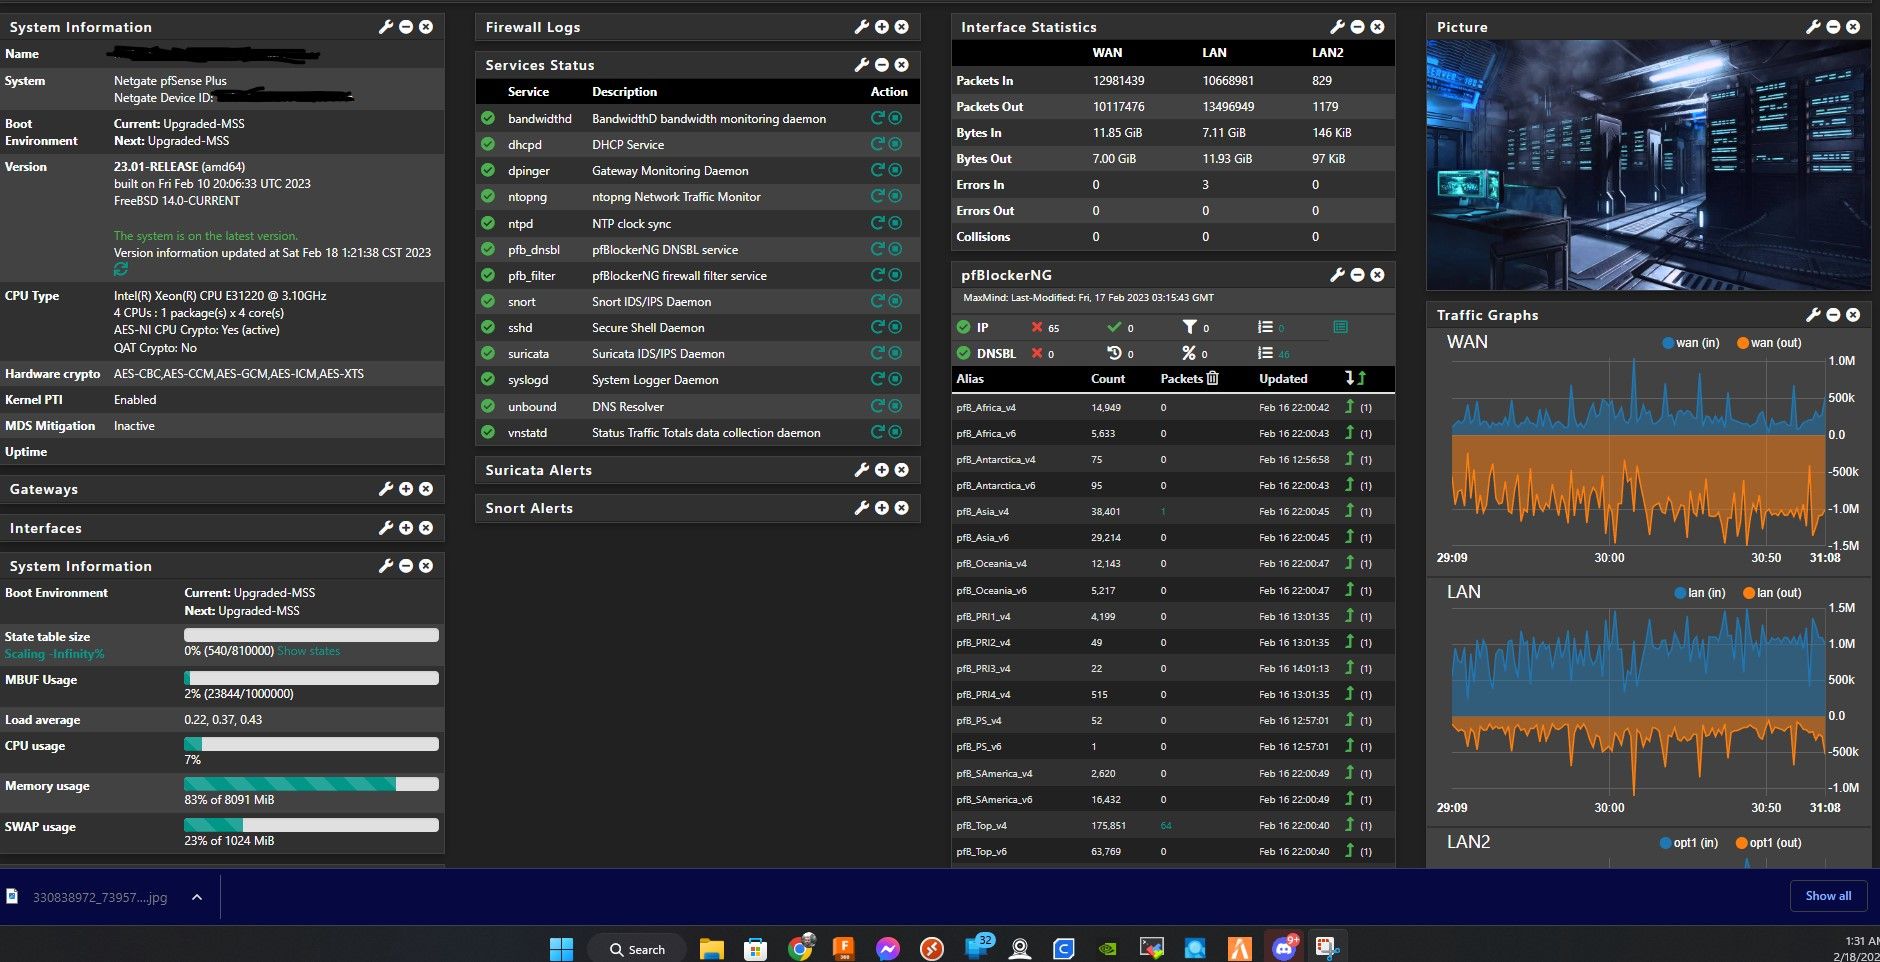
-
@jimp
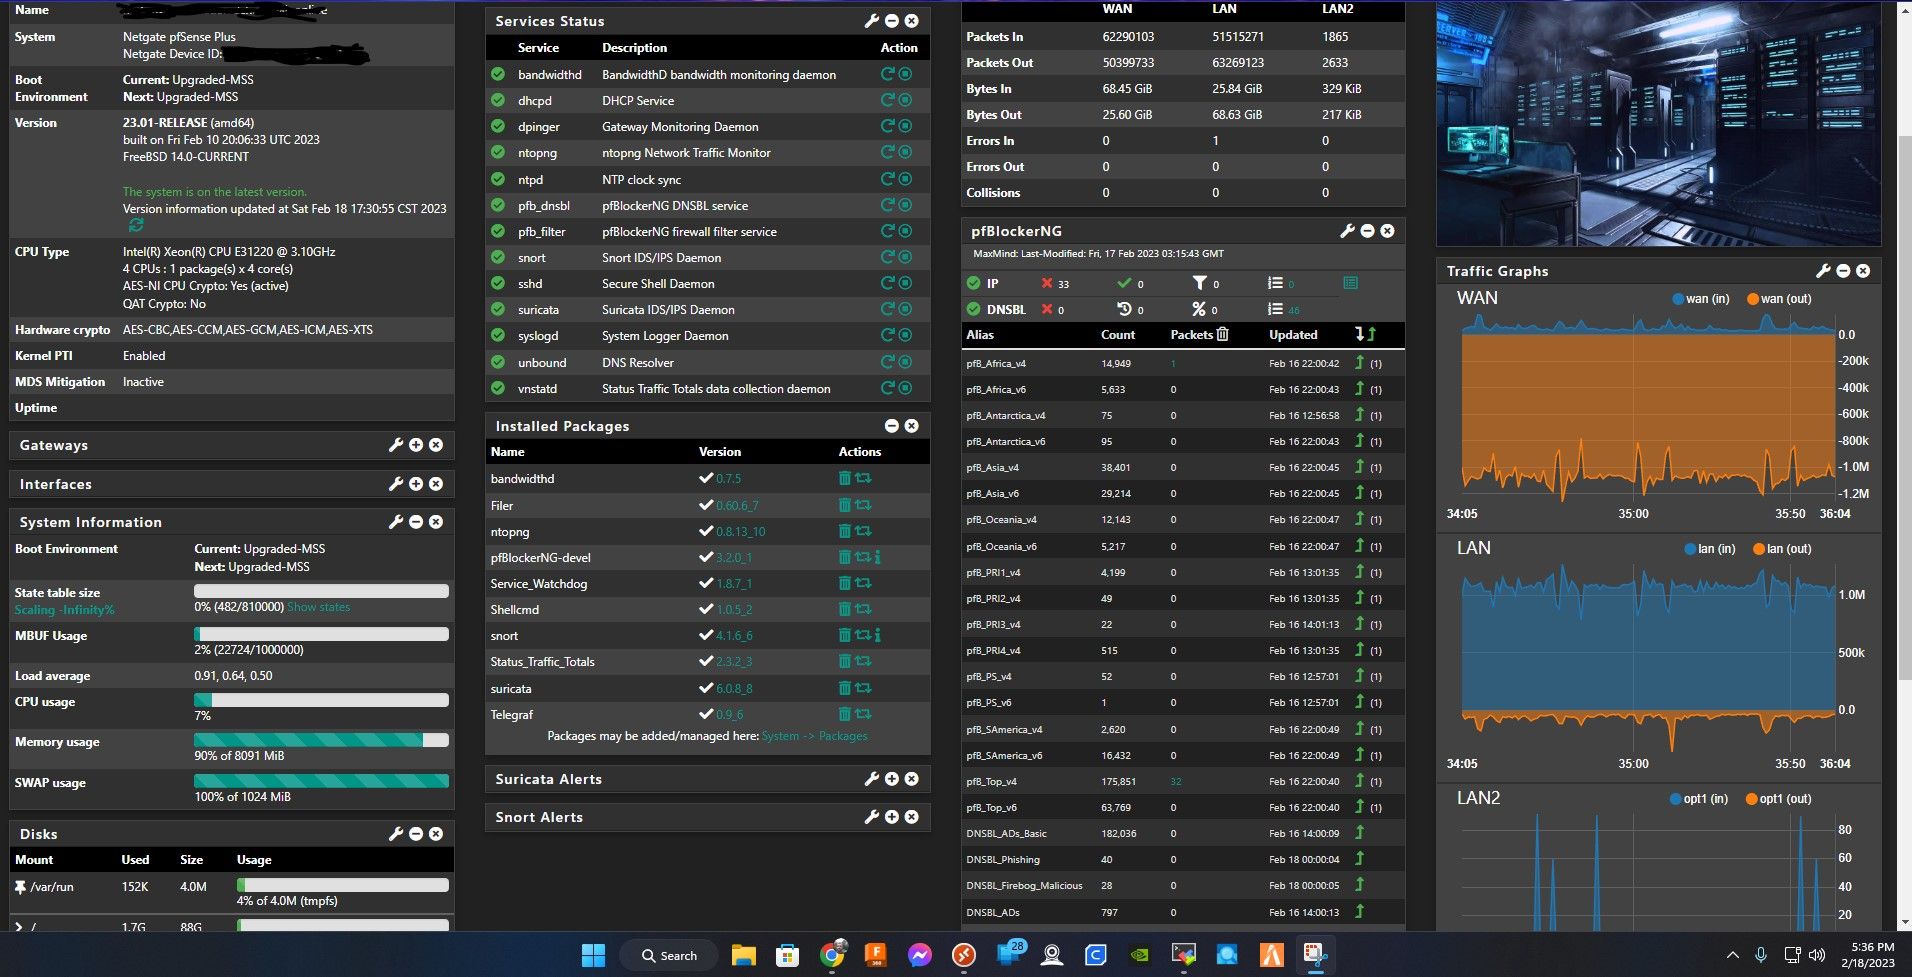
here's after 15 hours of uptime.
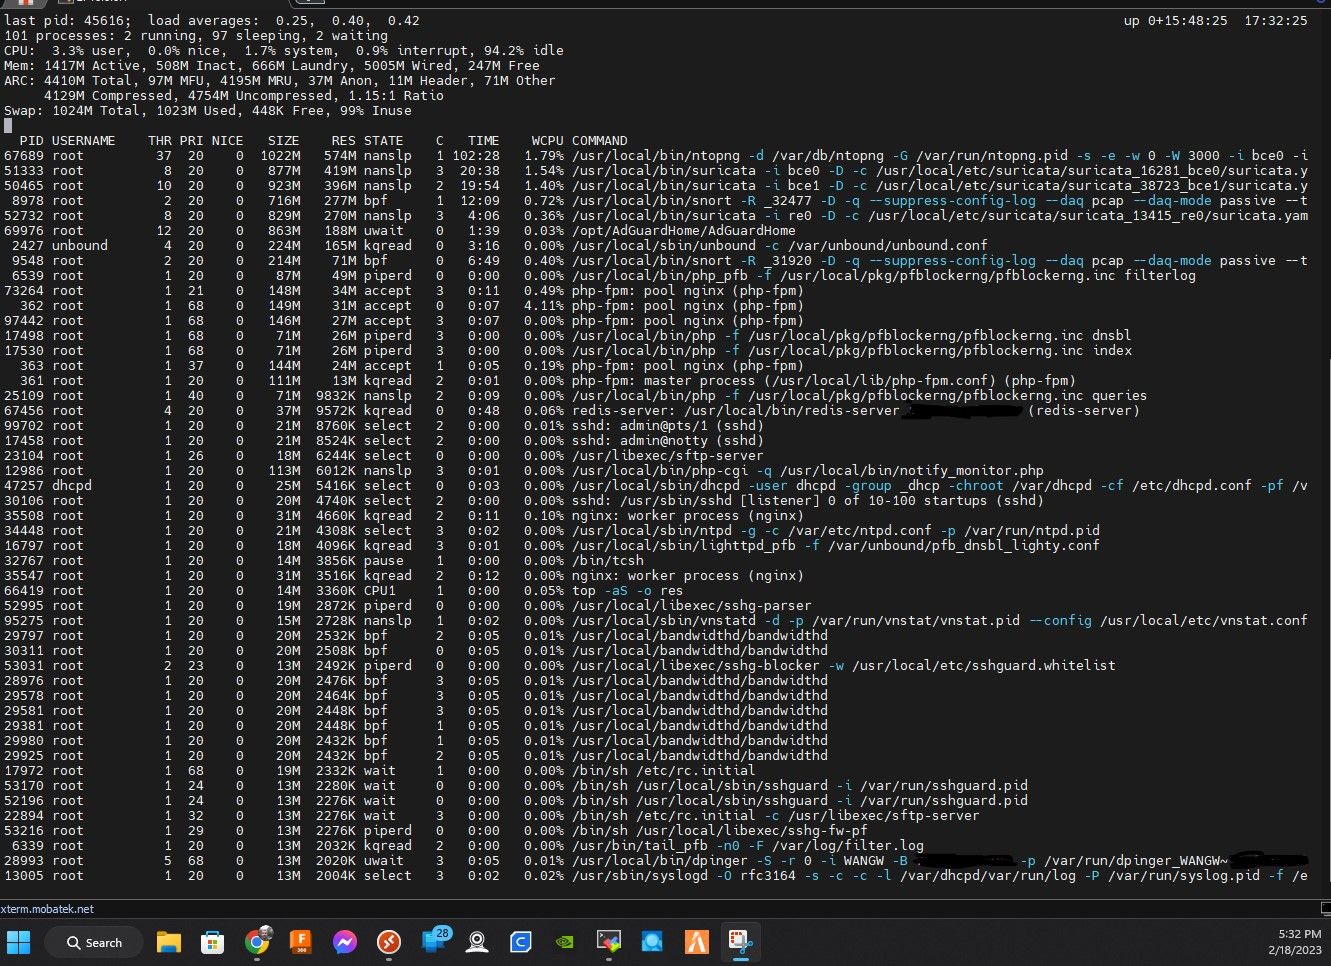
-
At least from that top output it appears the ARC usage is still going up, probably any time there is a scheduled process that hits the disk a lot it will go up (e.g. updating rules for snort/suricata/whatever). But that ARC memory will be released as needed so it looks worse than it really is.
-
Mmm, 100% SWAP usage is... not great though.
-
OK I’m experiencing something similar. My 6100 MAX memory utilization was always between 18% and 20% on 22.05. After installing 23.01 on release day, the memory will start in the mid-teens and slowly creep its way back up to nearly 40% with the exact same configuration on my 6100 MAX within about 18 hours. Once I get to that point, I just reboot it and start the cycle all over again which has been every morning since release day.
What can I give you to help troubleshoot my issue?
-
@stephenw10 said in 23.1 using more RAM:
Mmm, 100% SWAP usage is... not great though.
Neither is running both Suricata and Snort, though.
-
@rcoleman-netgate, @stephenw10 Yea, I realized that. running snort and suricata after doing some research over the weekend so I stopped using Snort. I've done a complete fresh install, started all my setup from scratch only maintaining my DNS and DHCP settings. I installed all the plugins one by one, (testing one at a time for a period of time watching the results of RAM usage) to see if it only happened with certain plugins over the weekend. I started to notice the increase of RAM usage over time when pfBlockerNG or when Suricata was installed. None of the other plugins I'm running caused a increase of memory and only used about 7% of my memory with idle traffic only going up to about 17% with increased traffic. @jimp claiming it's not as bad as it looks, well when it's slowing down my network as i experienced while testing over the weekend and causing streaming videos to buffer and slowing down my data transfers over network I'd say it is exactly as bad as it looks.
-
@defenderllc said in 23.1 using more RAM:
the memory will start in the mid-teens and slowly creep its way back up to nearly 40% with the exact same configuration on my 6100 MAX within about 18 hours.
Does it just keep climbing if you do not reboot?
Is it actually causing a problem or just seems unexpected?
Steve
-
@stephenw10 Yes, for me it keeps climbing the longer it's running. and after SWAP fills up or gets around 70% I start to experience slow network issues. Streaming video from local plex server I start to experience buffering, Same with Youtube and transfering files are slowed down till I restart PFSense.