23.1 using more RAM
-
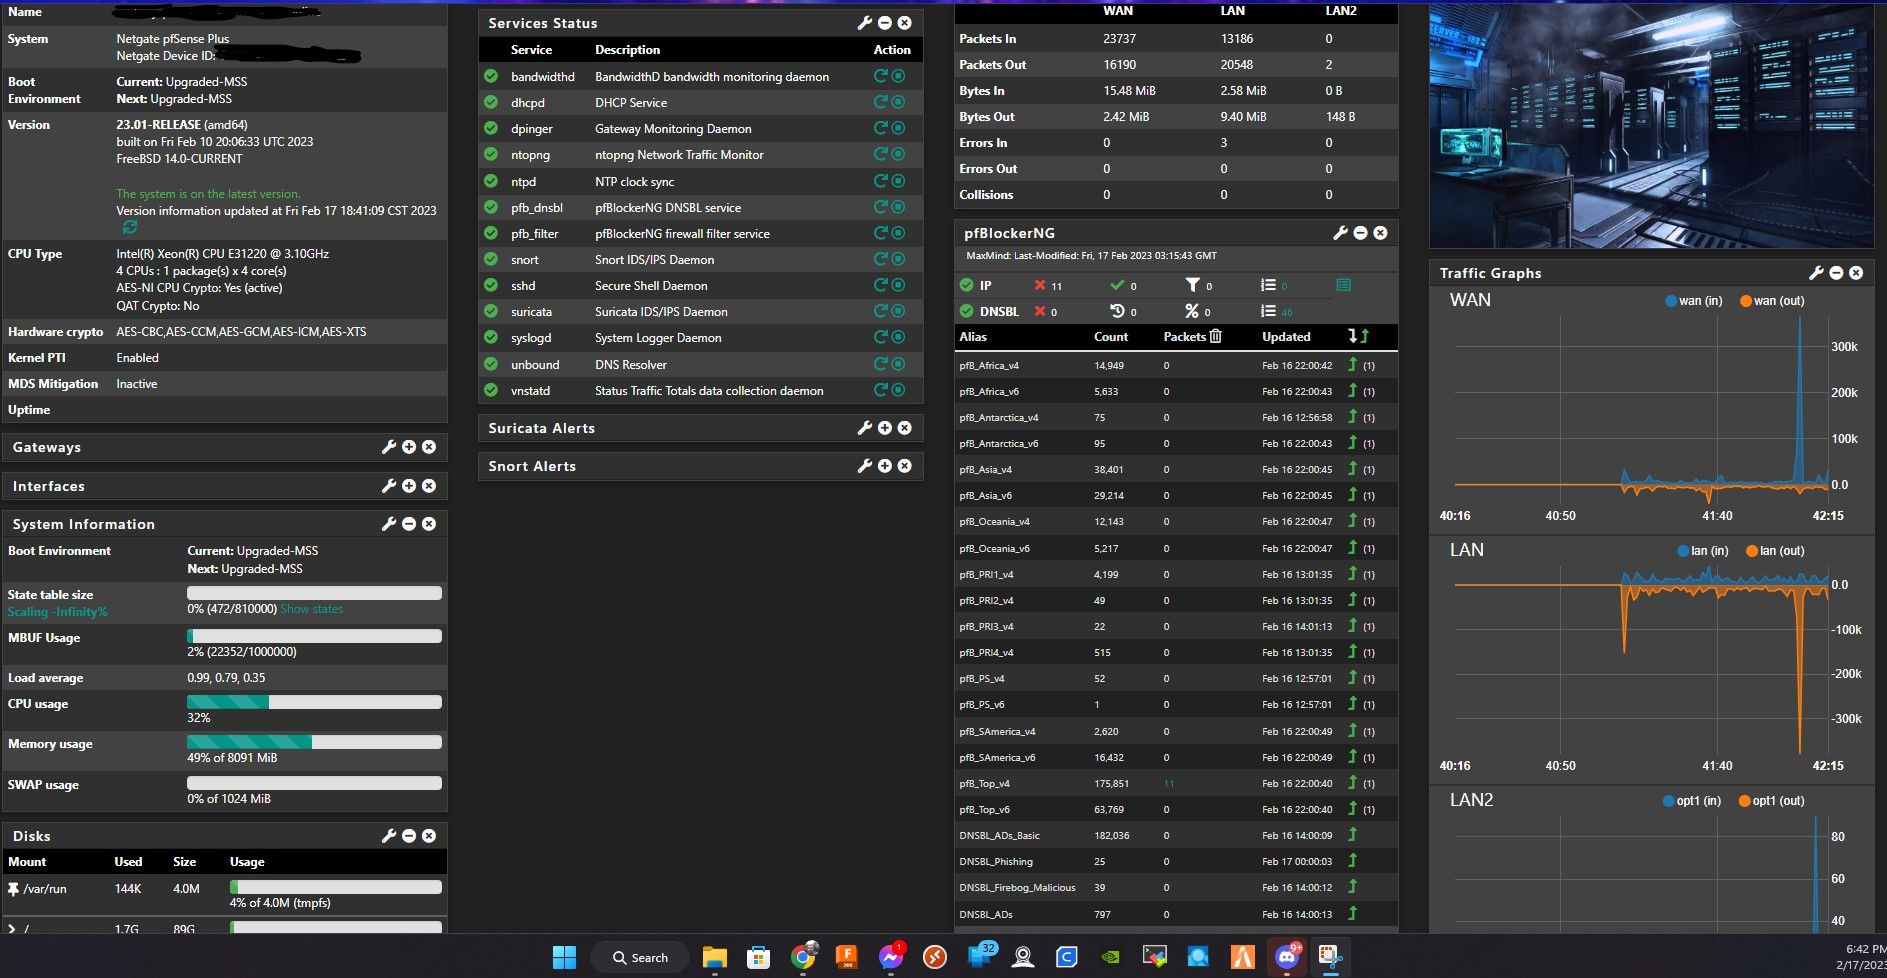 @stephenw10 I have no clue what happened ;-) it's as if after 8 - 9 hours of uptime the memory usage starts to increase over time which sounds like a memory leak to me.
I had to delete the comment I made prior to you posting this statement not realizing I forgot to hide my IP and your site wont allow me to edit MY post after some arbitrary time limit to repost the same screenshot with my IP blocked out:

So I'll repost it here to show overtime what I'm seeing with the memory usage!
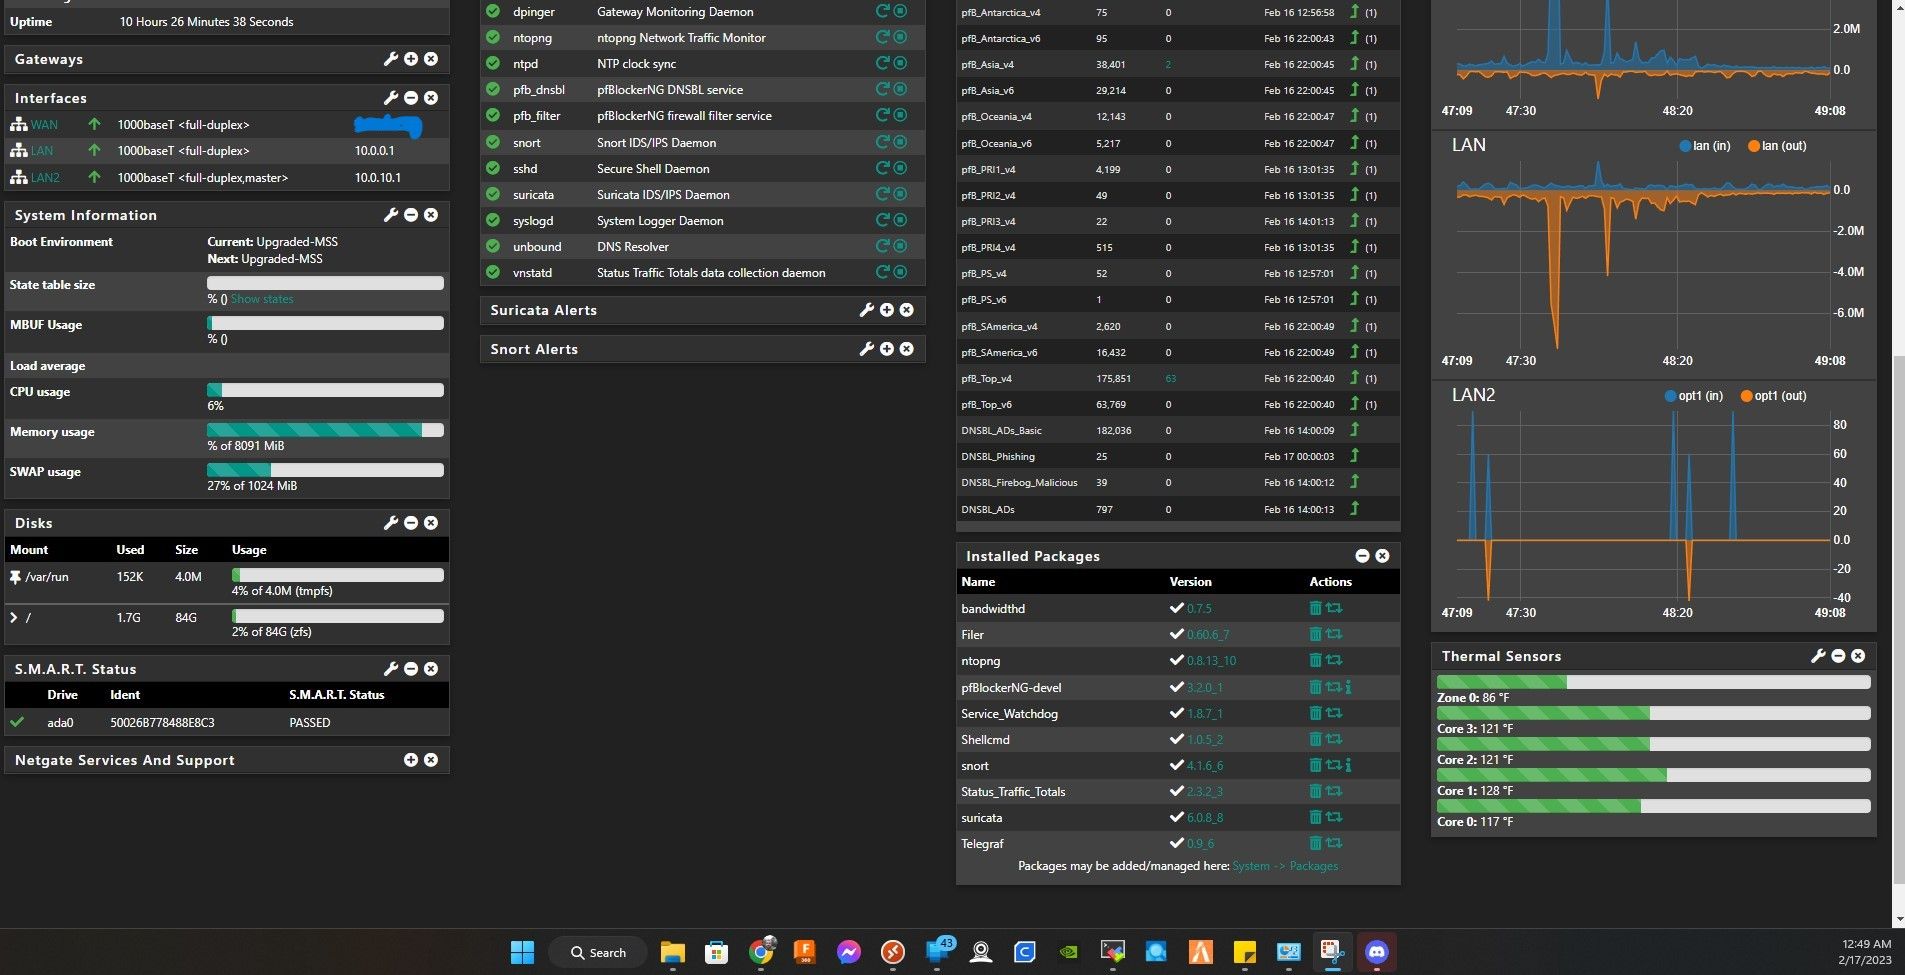
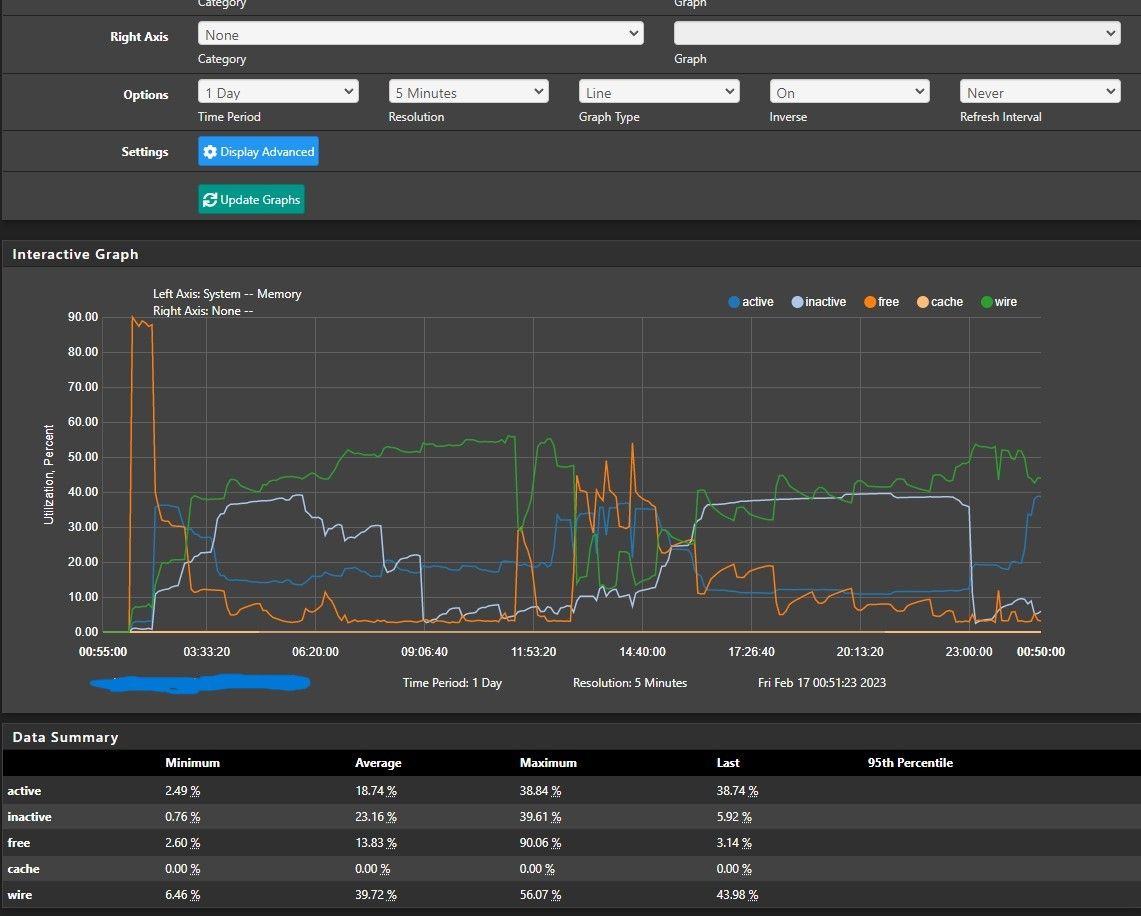
I had restarted it after taking those screenshots and the memory usage went back to normal. And again I had little network activity when taking those screen shots. Then 12+ hours later I take another look and see this:
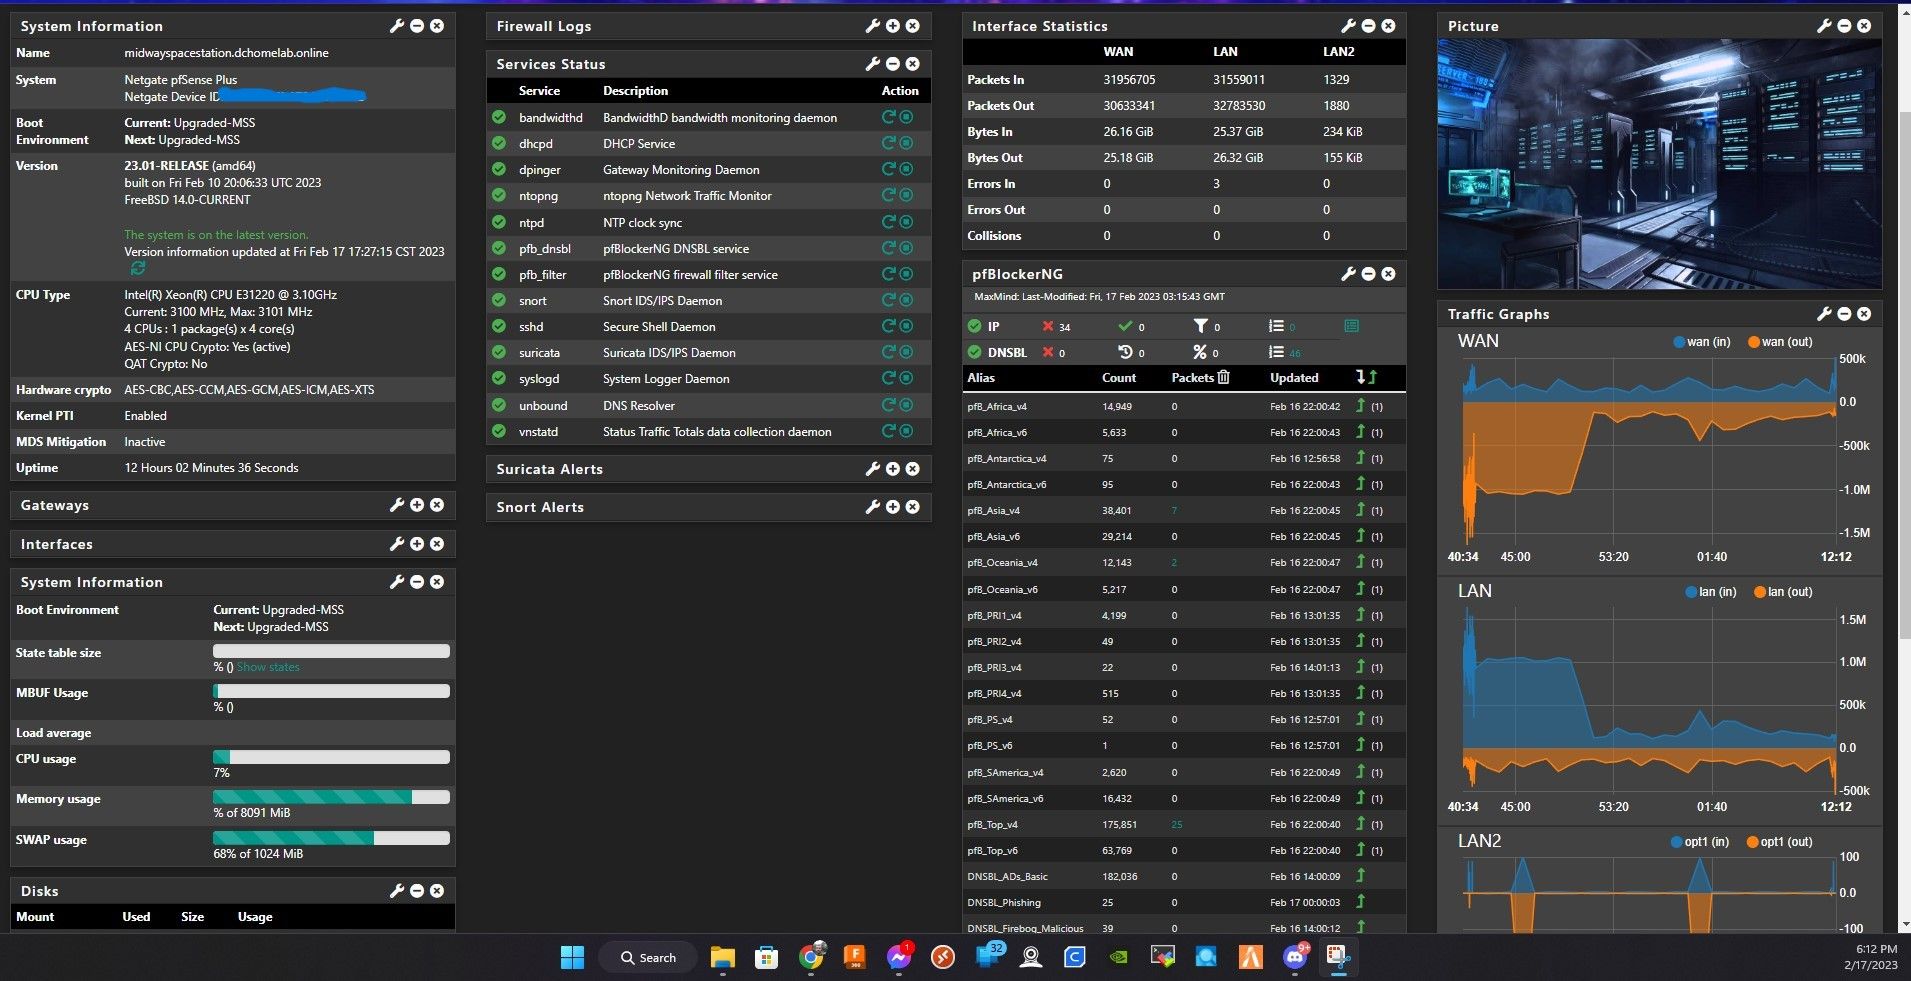
I restart again and see this:

-
@jimp kk, I had just restart it before reading this and posting my last screenshots. I'll let it run a bit and when I see memory usage start to increases I'll follow your recomendation.
-
@jimp This is about 2 hours later, So I guess I was wrong earlier when I stated it appears memory increasing after about 8 hours of uptime.
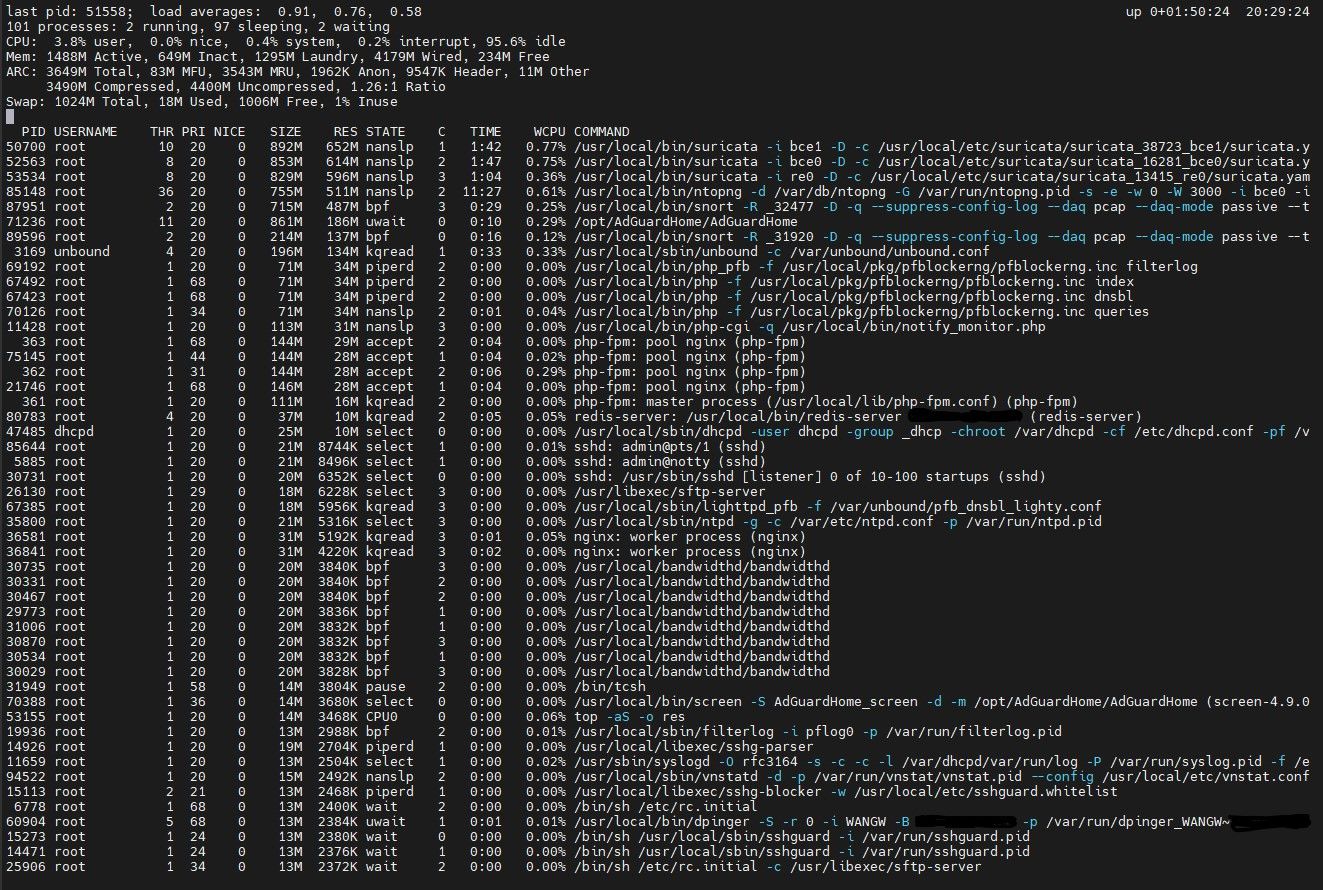
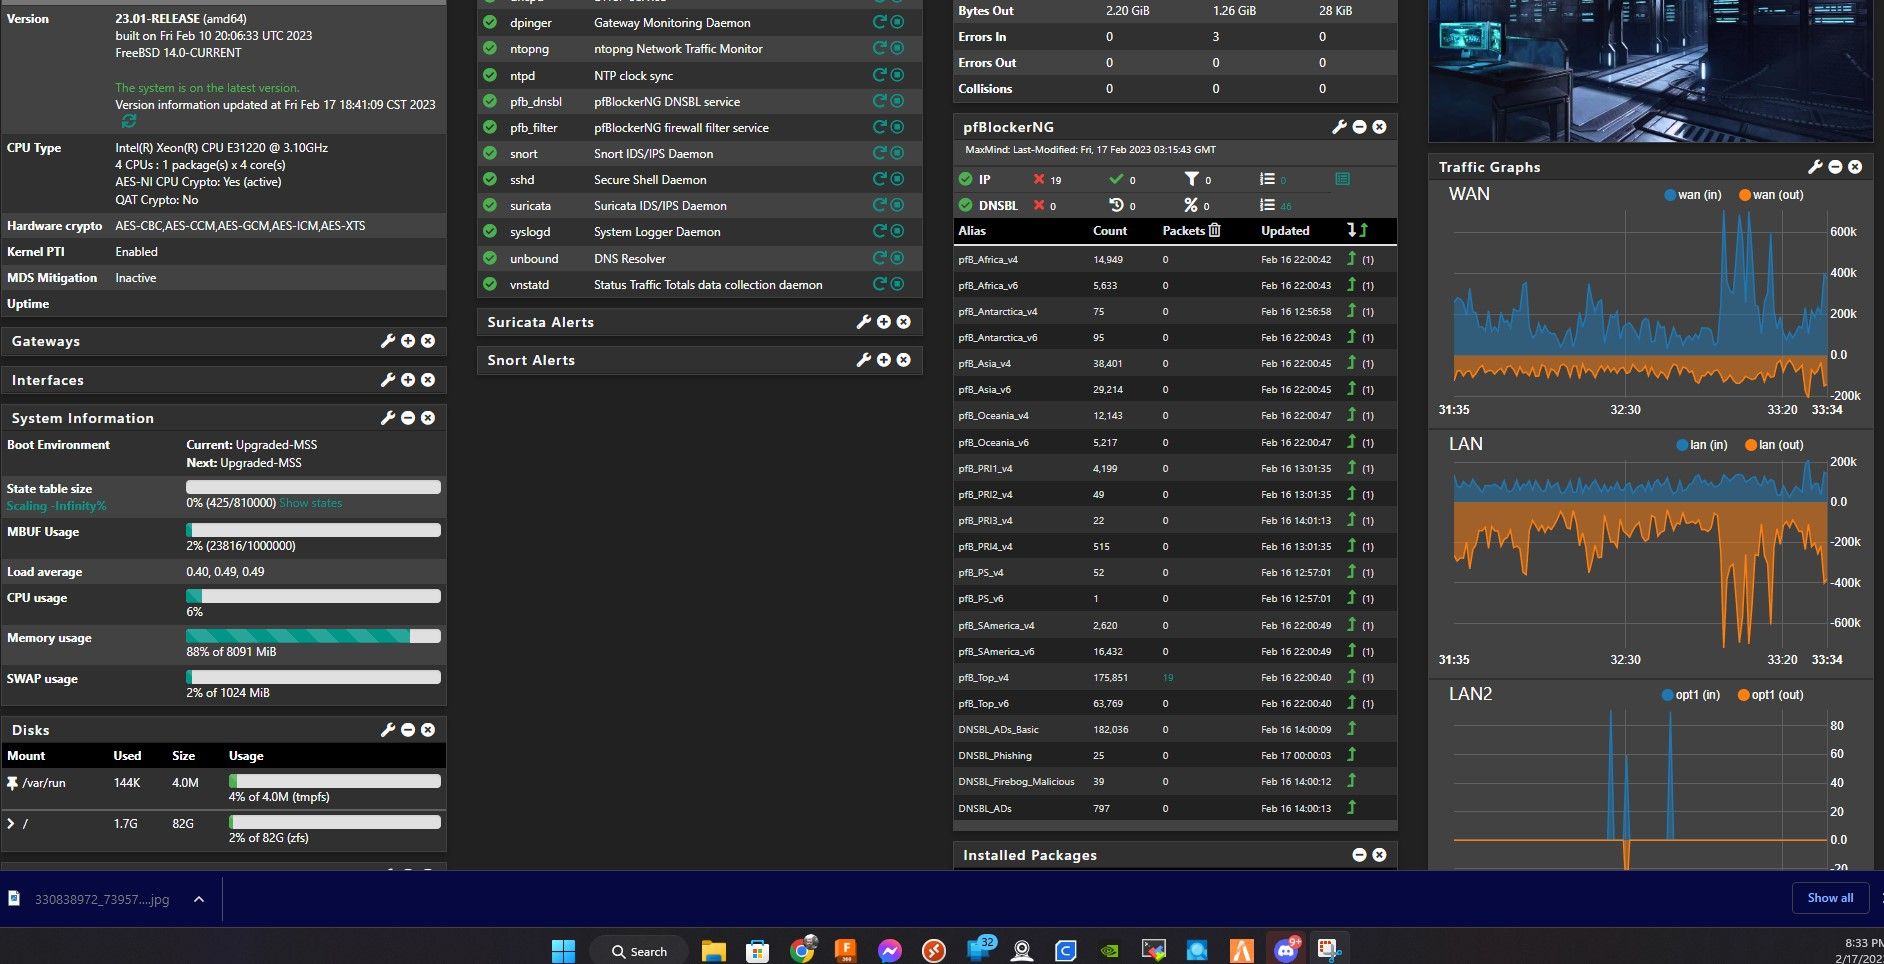
-
This post is deleted! -
@jimp Here's about 6 hours after the last two screenshots I posted.
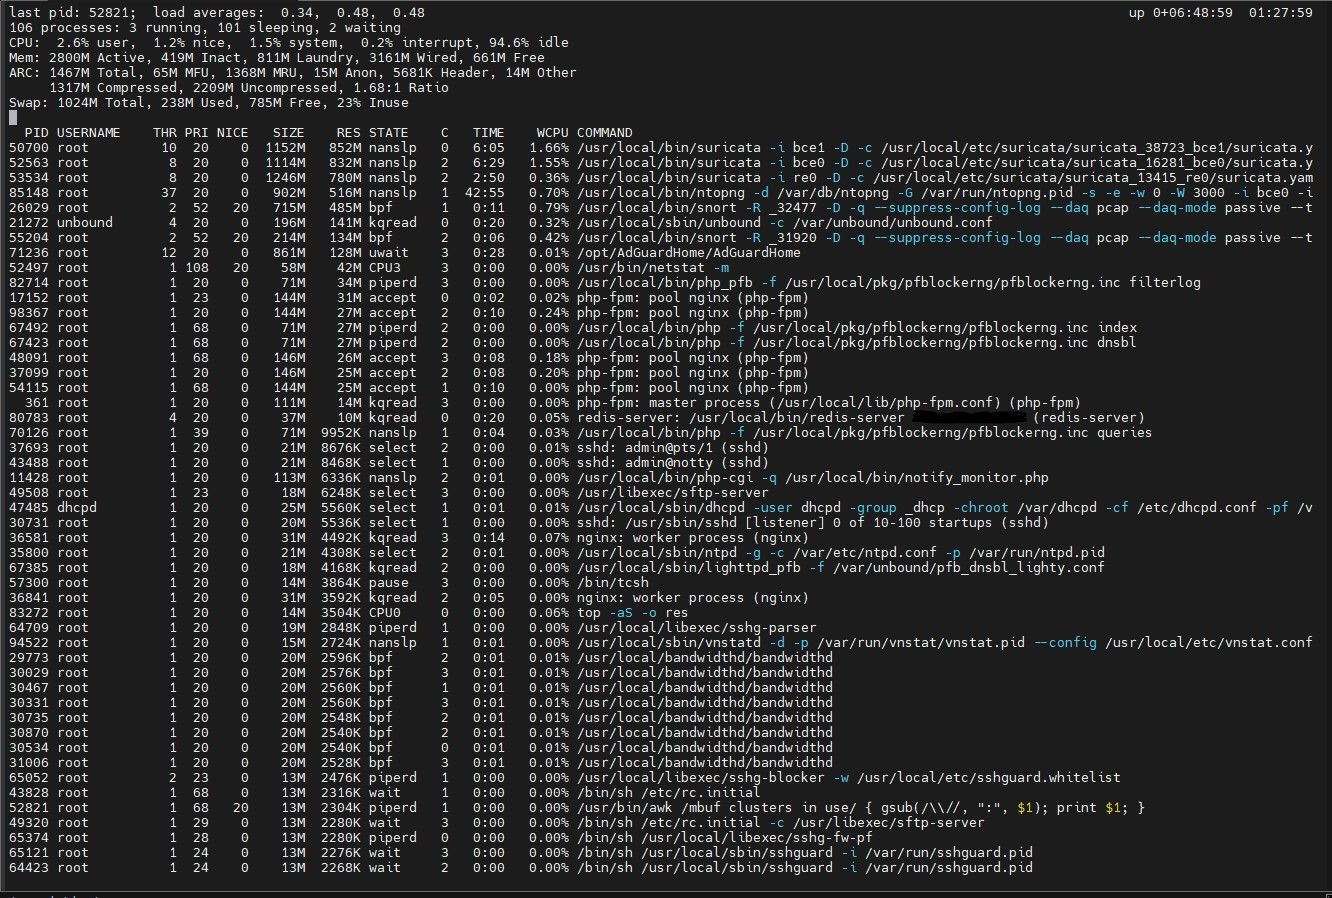
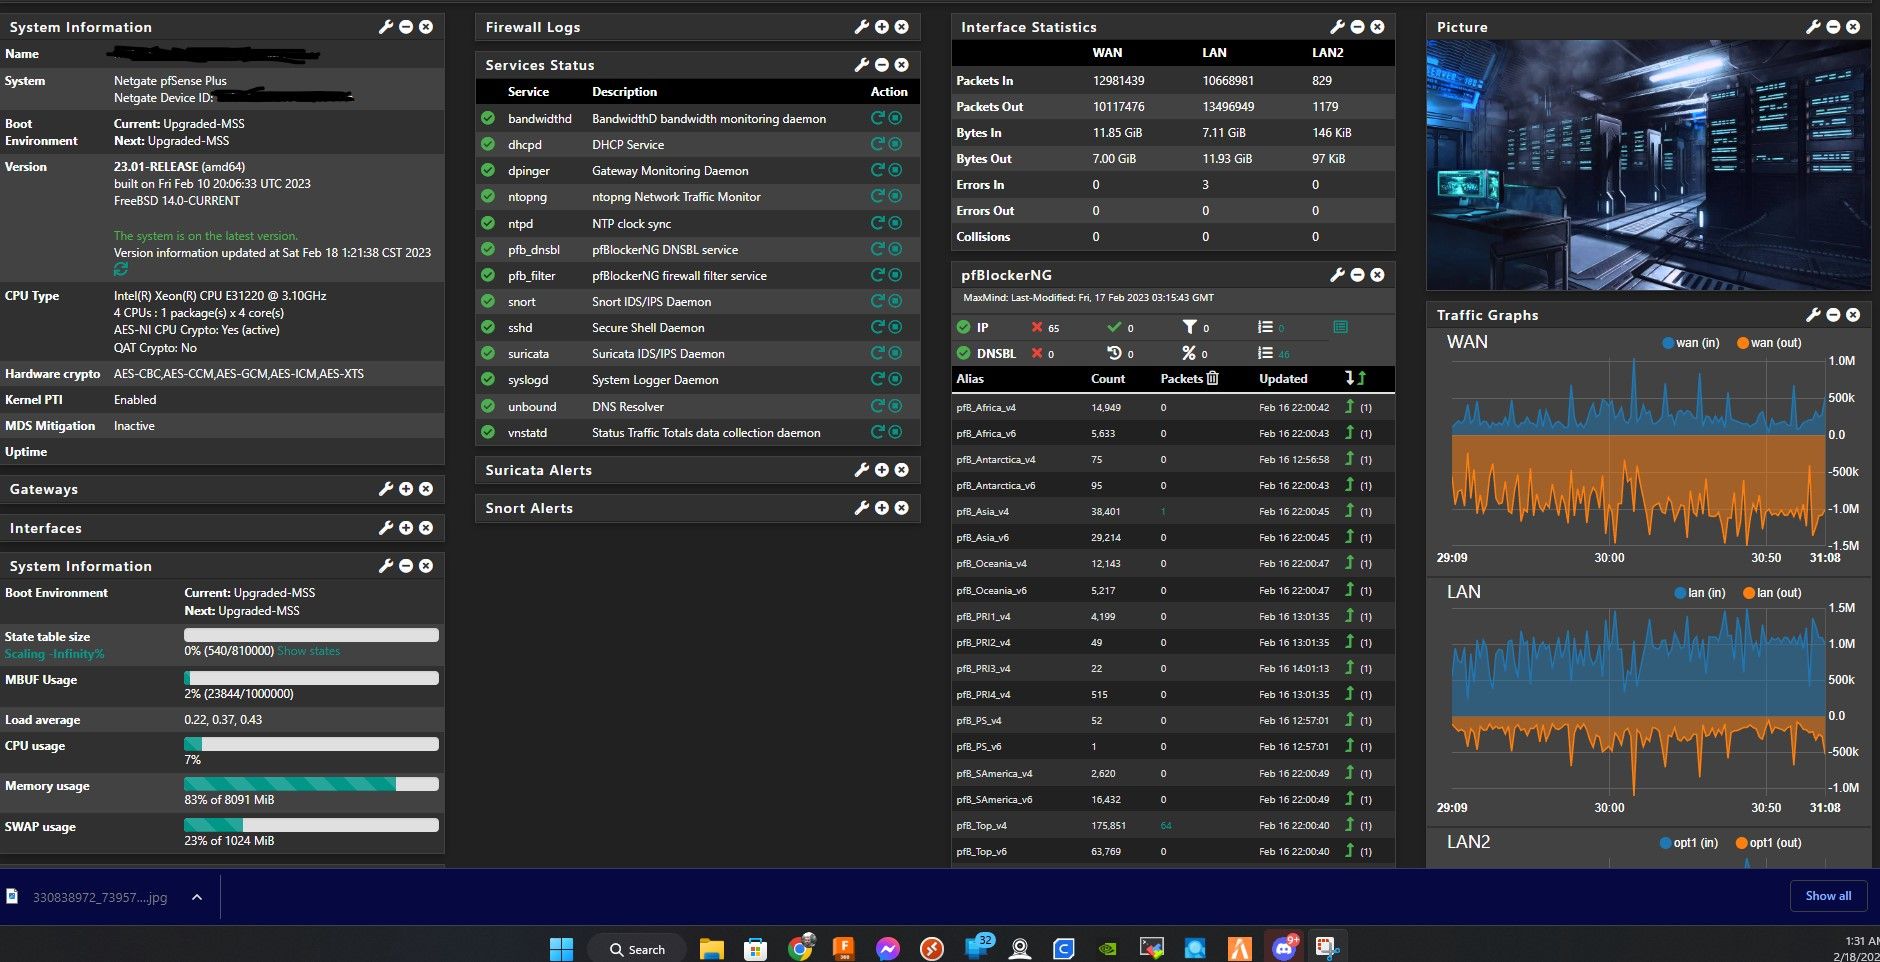
-
@jimp
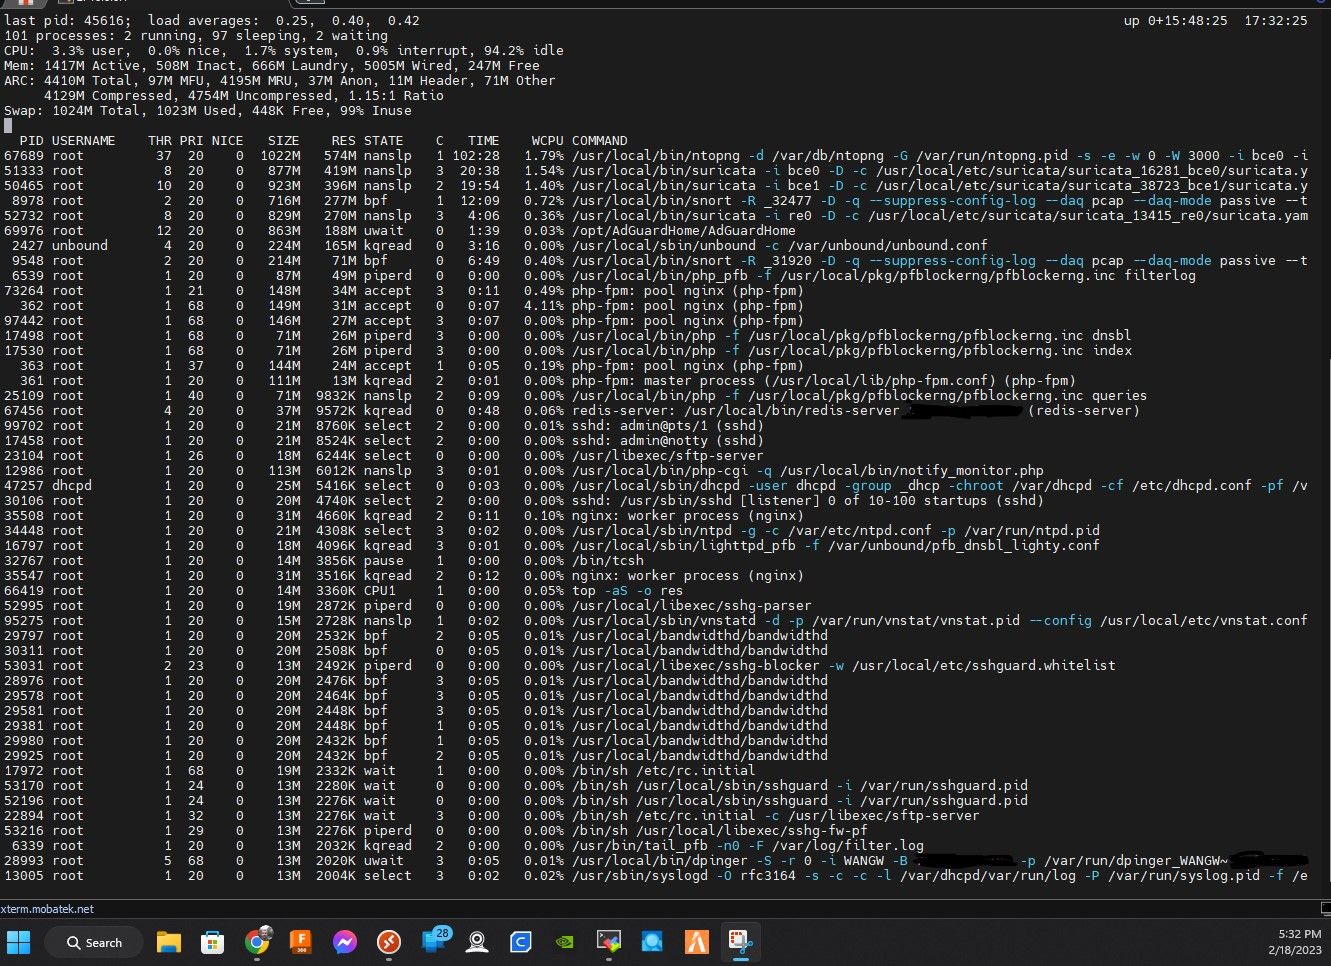
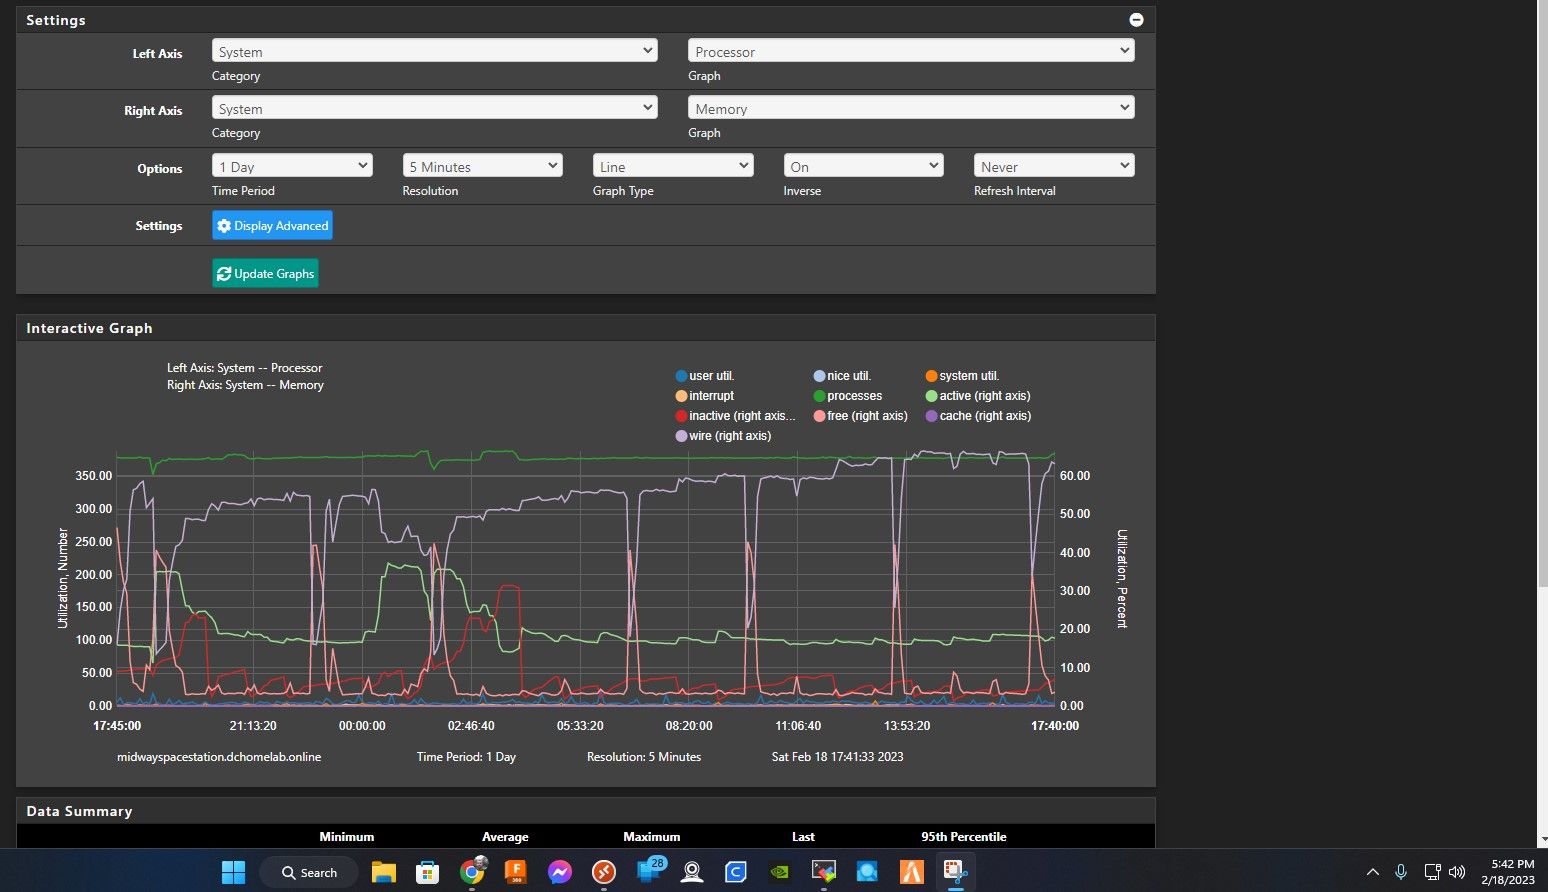
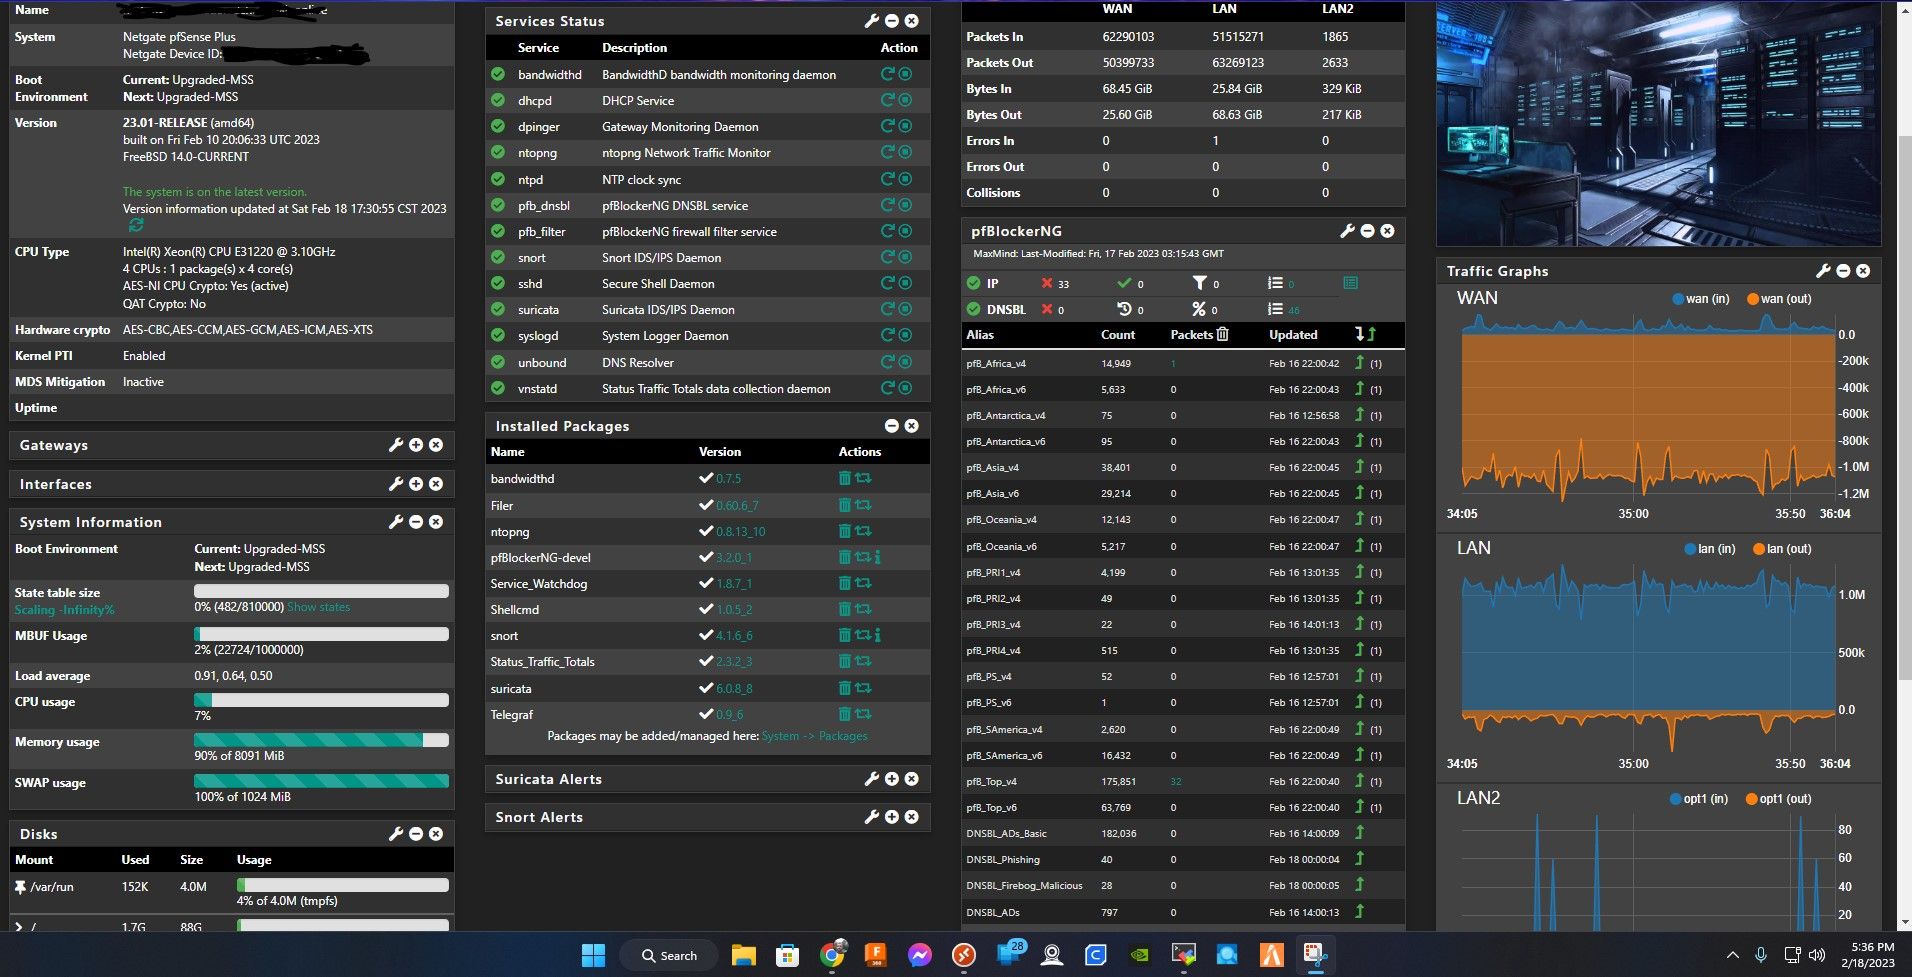
here's after 15 hours of uptime.
-
At least from that top output it appears the ARC usage is still going up, probably any time there is a scheduled process that hits the disk a lot it will go up (e.g. updating rules for snort/suricata/whatever). But that ARC memory will be released as needed so it looks worse than it really is.
-
Mmm, 100% SWAP usage is... not great though.
-
OK I’m experiencing something similar. My 6100 MAX memory utilization was always between 18% and 20% on 22.05. After installing 23.01 on release day, the memory will start in the mid-teens and slowly creep its way back up to nearly 40% with the exact same configuration on my 6100 MAX within about 18 hours. Once I get to that point, I just reboot it and start the cycle all over again which has been every morning since release day.
What can I give you to help troubleshoot my issue?
-
@stephenw10 said in 23.1 using more RAM:
Mmm, 100% SWAP usage is... not great though.
Neither is running both Suricata and Snort, though.
-
@rcoleman-netgate, @stephenw10 Yea, I realized that. running snort and suricata after doing some research over the weekend so I stopped using Snort. I've done a complete fresh install, started all my setup from scratch only maintaining my DNS and DHCP settings. I installed all the plugins one by one, (testing one at a time for a period of time watching the results of RAM usage) to see if it only happened with certain plugins over the weekend. I started to notice the increase of RAM usage over time when pfBlockerNG or when Suricata was installed. None of the other plugins I'm running caused a increase of memory and only used about 7% of my memory with idle traffic only going up to about 17% with increased traffic. @jimp claiming it's not as bad as it looks, well when it's slowing down my network as i experienced while testing over the weekend and causing streaming videos to buffer and slowing down my data transfers over network I'd say it is exactly as bad as it looks.
-
@defenderllc said in 23.1 using more RAM:
the memory will start in the mid-teens and slowly creep its way back up to nearly 40% with the exact same configuration on my 6100 MAX within about 18 hours.
Does it just keep climbing if you do not reboot?
Is it actually causing a problem or just seems unexpected?
Steve
-
@stephenw10 Yes, for me it keeps climbing the longer it's running. and after SWAP fills up or gets around 70% I start to experience slow network issues. Streaming video from local plex server I start to experience buffering, Same with Youtube and transfering files are slowed down till I restart PFSense.
-
@stephenw10 said in 23.1 using more RAM:
@defenderllc said in 23.1 using more RAM:
the memory will start in the mid-teens and slowly creep its way back up to nearly 40% with the exact same configuration on my 6100 MAX within about 18 hours.
Does it just keep climbing if you do not reboot?
Is it actually causing a problem or just seems unexpected?
Steve
Yes it does exactly that, but it is very slow increment. Once it gets close to 40%, it never seems to go down much. It might go down 1% or 2% here and there, but never returns to the original state of 18% to 20%. It’s worth noting it’s not causing any problems, but when the memory utilization doubles overnight, it just concerns me that there might be a memory leak. I’m going to let it run for a few days without rebooting it to see what it does.
I’m using my 6100 strictly as a DMZ firewall only and for primary DNS with pfBlocker. I have a UDM behind it that manages the clients, but the 6100 is the network-wide primary DNS. I do have Suricata installed, but it’s not really doing anything at the moment. Unbound and ntop seem to always be using a lot of RAM since upgrading to 23.01.
-
Me too. For sure I use a slower hardware then you, but after upgrading and rebooting several times (setting backup playing in, ....) It went "normal" for my setup, but that said with a small higher CPU usage RAM usage and Swap usage too.
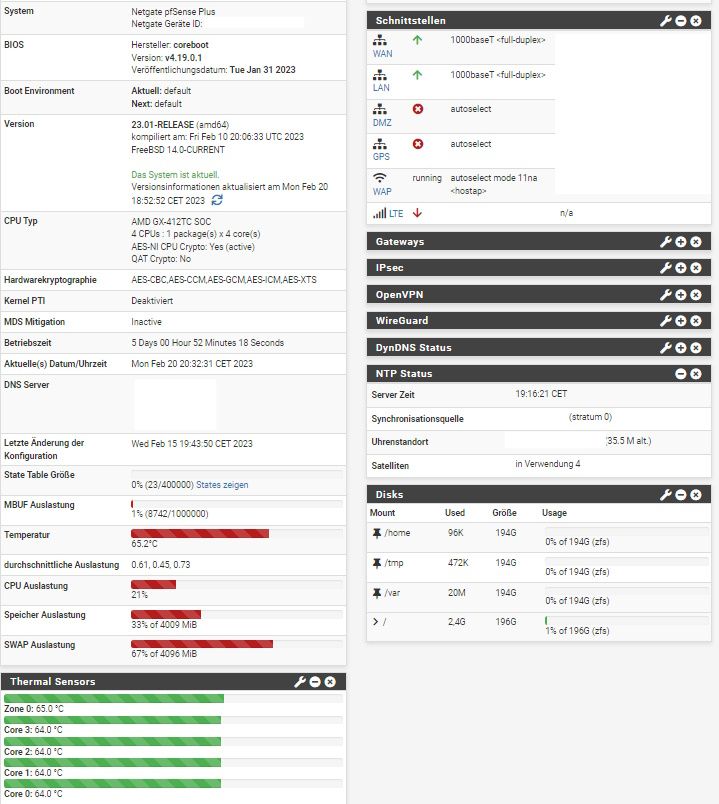

running on APU4D4
- with tuned CPU from 600MHz - 1000MHz to
1000MHz - 1400MHz
running as UTM - Snort, Squid, SquidGuard, ClamAV and pfBlocker-NG
After a while, it becomes more stable and using "less" ram, cpu and swap but more as before together with 22.05!
- with tuned CPU from 600MHz - 1000MHz to
-
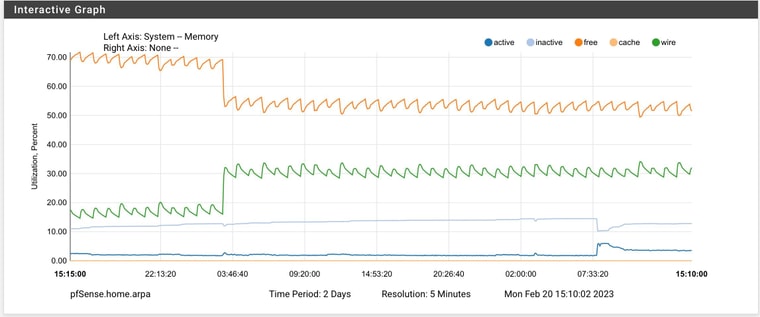
Looks like my spikes begin at 3AM and never return to normal. A few others shared this exact same issue (and at the exact same time). This is my memory utilization for the past 2 days and is the same each morning after a reboot the night before:
-
Check the cron table for what is triggered at that time?
I'd guess it's a pfBlocker or Snort update.
-
FWIW (I realise the memory change is only since you upgraded) I run telegraf & pfblocker (not Suricata), but my telegraf config differs from yours only by:
from_beginning = falseYou could try changing that as I haven't noticed any memory difference since upgrading.
Maybe telegraf is keeping more of that data in memory than it used to and not releasing it. -
@stephenw10 said in 23.1 using more RAM:
Check the cron table for what is triggered at that time?
I'd guess it's a pfBlocker or Snort update.
I don’t run snort and my pfBlocker lists update every hour. I’ll take a look. What’s the best way for me to figure out what’s running at 3AM without having to stay up to watch it? Thanks.
FYI, I rebooted at 4 PM today. I will share tomorrow morning’s graph where I expect the behavior will be exactly the same.
-
Check the cron table. You can install the cron package to do that easily.
Check the system logs at that time, what was logged?
Steve