Intermittently Unresponsive in Hyper-V
-
I'm hoping someone can help me track down an intermittent lockup issue. This is a HyperV setup that has been stable for years with 4gb ram and 16gb storage allocated. Yesterday I restored our config to a fresh 2.7.0 install. I can't seem to connect the dots from the system logs:
Example 1:
Aug 17 08:44:46 firewall login[5015]: login on ttyv0 as root
Aug 17 08:44:46 firewall sshguard[14244]: Now monitoring attacks.
Aug 17 08:44:50 firewall kernel: hn0: promiscuous mode enabled
Aug 17 08:45:00 firewall sshguard[14244]: Exiting on signal.
Aug 17 08:45:00 firewall sshguard[36933]: Now monitoring attacks.
Aug 17 08:46:00 firewall sshguard[36933]: Exiting on signal.
Aug 17 08:46:00 firewall sshguard[72523]: Now monitoring attacks.
Aug 17 09:00:00 firewall sshguard[72523]: Exiting on signal.
Aug 17 09:00:00 firewall sshguard[56739]: Now monitoring attacks.
Aug 17 09:00:01 firewall php[53120]: [pfBlockerNG] Starting cron process.
Aug 17 09:00:09 firewall php[53120]: [pfBlockerNG] No changes to Firewall rules, skipping Filter Reload
Aug 17 09:00:09 firewall php[53120]:
Aug 17 09:01:00 firewall sshguard[56739]: Exiting on signal.
Aug 17 09:01:00 firewall sshguard[81899]: Now monitoring attacks.
Aug 17 09:06:44 firewall syslogd: kernel boot file is /boot/kernel/kernel
Aug 17 09:06:44 firewall kernel: ---<<BOOT>>---
Example 2:
Aug 17 09:08:01 firewall login[73857]: login on ttyv0 as root
Aug 17 09:08:06 firewall kernel: hn0: promiscuous mode enabled
Aug 17 09:16:00 firewall sshguard[69542]: Exiting on signal.
Aug 17 09:16:00 firewall sshguard[11959]: Now monitoring attacks.
Aug 17 09:18:00 firewall sshguard[11959]: Exiting on signal.
Aug 17 09:18:00 firewall sshguard[2266]: Now monitoring attacks.
Aug 17 09:22:00 firewall sshguard[2266]: Exiting on signal.
Aug 17 09:22:00 firewall sshguard[65181]: Now monitoring attacks.
Aug 17 09:25:38 firewall snort[97016]: S5: Pruned 4 sessions from cache for memcap. 229 scbs remain. memcap: 8388355/8388608
Aug 17 09:29:41 firewall syslogd: kernel boot file is /boot/kernel/kernel
Aug 17 09:29:41 firewall kernel: ---<<BOOT>>---
Example 3:
Aug 17 09:30:58 firewall login[41242]: login on ttyv0 as root
Aug 17 09:31:00 firewall sshguard[38601]: Exiting on signal.
Aug 17 09:31:00 firewall sshguard[56420]: Now monitoring attacks.
Aug 17 09:31:03 firewall kernel: hn0: promiscuous mode enabled
Aug 17 09:32:00 firewall sshguard[56420]: Exiting on signal.
Aug 17 09:32:00 firewall sshguard[44280]: Now monitoring attacks.
Aug 17 09:44:00 firewall sshguard[44280]: Exiting on signal.
Aug 17 09:44:00 firewall sshguard[97348]: Now monitoring attacks.
Aug 17 09:46:00 firewall sshguard[97348]: Exiting on signal.
Aug 17 09:46:00 firewall sshguard[49805]: Now monitoring attacks.
Aug 17 10:05:18 firewall kernel: sonewconn: pcb 0xfffff8001dc45000 (127.0.0.1:3128 (proto 6)): Listen queue overflow: 193 already in queue awaiting acceptance (1 occurrences), euid 0, rgid 62, jail 0
Aug 17 10:05:18 firewall kernel: sonewconn: pcb 0xfffff8001dc45000 (127.0.0.1:3128 (proto 6)): Listen queue overflow: 193 already in queue awaiting acceptance (16 occurrences), euid 0, rgid 62, jail 0
Aug 17 10:05:18 firewall kernel: sonewconn: pcb 0xfffff8001dc45000 (127.0.0.1:3128 (proto 6)): Listen queue overflow: 193 already in queue awaiting acceptance (18 occurrences), euid 0, rgid 62, jail 0
Aug 17 10:05:18 firewall kernel: sonewconn: pcb 0xfffff8001dc45000 (127.0.0.1:3128 (proto 6)): Listen queue overflow: 193 already in queue awaiting acceptance (19 occurrences), euid 0, rgid 62, jail 0
Aug 17 10:05:18 firewall kernel: sonewconn: pcb 0xfffff8001dc45000 (127.0.0.1:3128 (proto 6)): Listen queue overflow: 193 already in queue awaiting acceptance (20 occurrences), euid 0, rgid 62, jail 0
Aug 17 10:05:18 firewall kernel: sonewconn: pcb 0xfffff8001dc45000 (127.0.0.1:3128 (proto 6)): Listen queue overflow: 193 already in queue awaiting acceptance (8 occurrences), euid 0, rgid 62, jail 0
Aug 17 10:05:18 firewall kernel: sonewconn: pcb 0xfffff8001dc45000 (127.0.0.1:3128 (proto 6)): Listen queue overflow: 193 already in queue awaiting acceptance (12 occurrences), euid 0, rgid 62, jail 0
Aug 17 10:05:18 firewall kernel: sonewconn: pcb 0xfffff8001dc45000 (127.0.0.1:3128 (proto 6)): Listen queue overflow: 193 already in queue awaiting acceptance (11 occurrences), euid 0, rgid 62, jail 0
Aug 17 10:17:30 firewall syslogd: kernel boot file is /boot/kernel/kernel
Aug 17 10:17:30 firewall kernel: ---<<BOOT>>---
Example 4:
Aug 17 11:01:17 firewall rc.gateway_alarm[48664]: >>> Gateway alarm: GW_LAN (Addr:192.168.1.1 Alarm:0 RTT:49.944ms RTTsd:180.970ms Loss:0%)
Aug 17 11:01:17 firewall check_reload_status[416]: updating dyndns GW_LAN
Aug 17 11:01:17 firewall check_reload_status[416]: Restarting IPsec tunnels
Aug 17 11:01:17 firewall check_reload_status[416]: Restarting OpenVPN tunnels/interfaces
Aug 17 11:01:17 firewall check_reload_status[416]: Reloading filter
Aug 17 11:01:18 firewall php-fpm[53133]: /rc.openvpn: OpenVPN: One or more OpenVPN tunnel endpoints may have changed IP addresses. Reloading endpoints that may use GW_LAN.
Aug 17 11:24:00 firewall sshguard[23347]: Exiting on signal.
Aug 17 11:24:00 firewall sshguard[21169]: Now monitoring attacks.
Aug 17 11:27:23 firewall php-fpm[53133]: /widgets/widgets/pfblockerng.widget.php: Session timed out for user 'admin' from: 192.168.1.xxx (Local Database)
Aug 17 11:28:18 firewall rc.gateway_alarm[43389]: >>> Gateway alarm: WAN_DHCP (Addr:10.1.10.1 Alarm:1 RTT:4.264ms RTTsd:8.483ms Loss:22%)
Aug 17 11:28:18 firewall check_reload_status[416]: updating dyndns WAN_DHCP
Aug 17 11:28:18 firewall check_reload_status[416]: Restarting IPsec tunnels
Aug 17 11:28:18 firewall check_reload_status[416]: Restarting OpenVPN tunnels/interfaces
Aug 17 11:28:18 firewall check_reload_status[416]: Reloading filter
Aug 17 11:28:48 firewall php-fpm[11141]: /rc.dyndns.update: phpDynDNS ([removed]): No change in my IP address and/or 25 days has not passed. Not updating dynamic DNS entry.
Aug 17 11:31:19 firewall syslogd: kernel boot file is /boot/kernel/kernel
Aug 17 11:31:19 firewall kernel: ---<<BOOT>>---
Example 5:
Aug 17 11:32:42 firewall login[9150]: login on ttyv0 as root
Aug 17 11:32:42 firewall sshguard[15356]: Now monitoring attacks.
Aug 17 11:33:00 firewall sshguard[15356]: Exiting on signal.
Aug 17 11:33:00 firewall sshguard[2697]: Now monitoring attacks.
Aug 17 11:33:37 firewall sshd[8073]: Accepted keyboard-interactive/pam for admin from 192.168.1.xxx port 20388 ssh2
Aug 17 11:33:54 firewall sshd[10469]: Accepted keyboard-interactive/pam for admin from 192.168.1.xxx port 20391 ssh2
Aug 17 11:46:00 firewall sshguard[2697]: Exiting on signal.
Aug 17 11:46:00 firewall sshguard[13562]: Now monitoring attacks.
Aug 17 11:47:00 firewall sshguard[13562]: Exiting on signal.
Aug 17 11:47:00 firewall sshguard[48679]: Now monitoring attacks.
Aug 17 12:28:06 firewall syslogd: kernel boot file is /boot/kernel/kernel
Aug 17 12:28:06 firewall kernel: ---<<BOOT>>---
My initial hunch was that this was related to our 2.6.0 to 2.7.0 migration OpenVPN S2S challenges, but disabling that service (and leaving our remote access serive online) did not help.
The sonewconn entry led me to try increasing the queue from 128 to 512. I've correlated less frequent hangups to this change, but it's still hanging.
I powercycled our Comcast gateway thinking it was contributing to rc.gateway_alarm and our bandwidth use is minimal during these hangs.
top screenshots from when it hangs show 0bytes SWAP usage, but that may be because it's not truly real time.
-
Nothing shown there indicates why but it's rebooting. Is that happening by itself or are you manually rebooting it?
Do you see a crash report after it boots back up?
What hardware is the hypervisor?
Steve
-
I have to stop the VM and restart it as it's unresponsive on SSH/Web/VM console.
Nothing in /var/crash/ since 75 days ago and no reference to "crash" in the system.log
The host is a Xeon E3-1265Lv2 / 32gb / AsRock E3C204-4L / Server 2019. Host is about 98% free disk space. VM is 95% free space. VM is not stored on the Host OS drive.
A few minutes after my original post (4 hours ago), the GUI became unresponsive, so I did a Restart PHP-FPM and it's behaved ever since. That's the longest uptime window we've had in days.
-
Hmm, nothing shown even at the console directly?
If it seems completely unresponsive try sending 'ctl+t'. That can show a stalled process when nothing else does.
-
Just locked up after about 6 hours of being up. Short version: Restart PHP-FPM seems to get it back online without reboot. Before doing that:
- VM console is non-responsive. Close and reopen and it's responsive again
- SSH dropped but I was able to reconnect
- I'm typing here, but I get no ping response from the firewall and no ping response from 8.8.8.8
- ctrl-t = load: 3.52 cmd: sh 61905 [ttyin] 481.55r 0.00u 0.00s 0% 3000k
Systemlog snippet:
Aug 17 18:31:00 firewall sshguard[45905]: Exiting on signal. Aug 17 18:31:00 firewall sshguard[27826]: Now monitoring attacks. Aug 17 18:49:00 firewall sshguard[27826]: Exiting on signal. Aug 17 18:49:00 firewall sshguard[14756]: Now monitoring attacks. Aug 17 19:00:02 firewall php[92820]: [pfBlockerNG] Starting cron process. Aug 17 19:00:11 firewall php[92820]: [pfBlockerNG] No changes to Firewall rules, skipping Filter Reload Aug 17 19:00:11 firewall php[92820]: Aug 17 19:00:12 firewall rc.gateway_alarm[18784]: >>> Gateway alarm: GW_LAN (Addr:192.168.1.1 Alarm:1 RTT:752.940ms RTTsd:2054.985ms Loss:0%) Aug 17 19:00:12 firewall check_reload_status[37018]: updating dyndns GW_LAN Aug 17 19:00:12 firewall check_reload_status[37018]: Restarting IPsec tunnels Aug 17 19:00:12 firewall check_reload_status[37018]: Restarting OpenVPN tunnels/interfaces Aug 17 19:00:12 firewall check_reload_status[37018]: Reloading filter Aug 17 19:00:14 firewall php-fpm[32927]: /rc.openvpn: OpenVPN: One or more OpenVPN tunnel endpoints may have changed IP addresses. Reloading endpoints that may use GW_LAN. Aug 17 19:01:15 firewall rc.gateway_alarm[82776]: >>> Gateway alarm: GW_LAN (Addr:192.168.1.1 Alarm:0 RTT:3.048ms RTTsd:9.669ms Loss:0%) Aug 17 19:01:15 firewall check_reload_status[37018]: updating dyndns GW_LAN Aug 17 19:01:15 firewall check_reload_status[37018]: Restarting IPsec tunnels Aug 17 19:01:15 firewall check_reload_status[37018]: Restarting OpenVPN tunnels/interfaces Aug 17 19:01:15 firewall check_reload_status[37018]: Reloading filter Aug 17 19:01:16 firewall php-fpm[98132]: /rc.openvpn: OpenVPN: One or more OpenVPN tunnel endpoints may have changed IP addresses. Reloading endpoints that may use GW_LAN. Aug 17 19:14:00 firewall sshguard[14756]: Exiting on signal. Aug 17 19:14:00 firewall sshguard[78498]: Now monitoring attacks. Aug 17 19:33:35 firewall sshd[61656]: Accepted keyboard-interactive/pam for admin from 192.168.1.195 port 23034 ssh2 Aug 17 19:42:12 firewall sshd[65753]: Accepted keyboard-interactive/pam for admin from 192.168.1.195 port 23297 ssh2 Aug 17 19:43:31 firewall rc.php-fpm_restart[65387]: >>> Restarting php-fpm Aug 17 19:43:31 firewall check_reload_status[66343]: check_reload_status is starting. Aug 17 19:43:51 firewall php-fpm[65793]: /index.php: Session timed out for user 'admin' from: 192.168.1.195 (Local Database) Aug 17 19:43:57 firewall php-fpm[65793]: /index.php: Successful login for user 'admin' from: 192.168.1.195 (Local Database) Aug 17 19:45:03 firewall sshguard[78498]: Exiting on signal. Aug 17 19:45:03 firewall sshguard[38855]: Now monitoring attacks. -
At what point in the log did it stop responding?
-
@spittlbm said in Intermittently Unresponsive:
rc.gateway_alarm[18784]: >>> Gateway alarm: GW_LAN (Addr:192.168.1.1 Alarm:1 RTT:752.940ms RTTsd:2054.985ms Loss:0%)
You really have a gateway in the LAN subnet at 192.168.1.1? That isn't the LAN address? Added as an IPSec routing work-around perhaps?
-
@stephenw10 said in Intermittently Unresponsive:
At what point in the log did it stop responding?
I don't know exactly when it quit, but it was sometime between the 19:14 and 19:33 entries.
The Lan address of pfsense is 192.168.1.1 and it's had that GW since it was setup in 2011. That seems consistent with the docs "On most networks a gateway resides in the same subnet as one of the interfaces on a host."
-
pfSense is the gateway for other hosts in the LAN subnet but it should not itself have a gateway defined there. You would only have gateway on LAN if you have other downstream routers there that pfSense needs to route traffic to. The only other reason would be the workaround for IPSec:
https://docs.netgate.com/pfsense/en/latest/vpn/ipsec/access-firewall-over-ipsec.html#static-route-workaroundBut in both those cases if you have a LAN side gateway you need to make sure the default IPv4 gateway in System > Routing > Gateways is set specifically to WAN. If it's set to automatic there the system may swtch to using the LAN gateway as default which will obviously fail.
Steve
-
This post is deleted! -
@stephenw10 errant GW disabled. System processed traffic overnight with the exception of nginx going down with a 502 Bad Gateway. Restart PHP-FPM got it back online.
System.log was full of this to the point it rolled over
Aug 18 09:45:05 firewall check_reload_status[66343]: Could not connect to /var/run/php-fpm.socketnignx had a few
Aug 18 09:47:10 firewall nginx: 2023/08/18 09:47:10 [error] 12916#100237: *2631 connect() to unix:/var/run/php-fpm.socket failed (61: Connection refused) while connecting to upstream, client: 192.168.1.195, server: , request: "GET / HTTP/2.0", upstream: "fastcgi://unix:/var/run/php-fpm.socket:", host: "192.168.1.1"kern.ipc.soacceptqueue = 128, so I bumped that up to 1024 via a system tunable and verified it applied.
-
Hmm, nothing logged to show why php stopped responding?
I suspect bumping that sysctl won't help if php never responds.
-
@stephenw10 what's the best way to increase logging for PHP?
-
There's no easy way to do that. You can check /tmp/php_errors.txt but I'd expect any php errors to be shown as an alert.
-
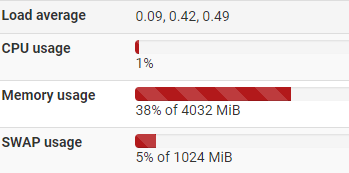
Logged in tonight to see SWAP was at 52%.
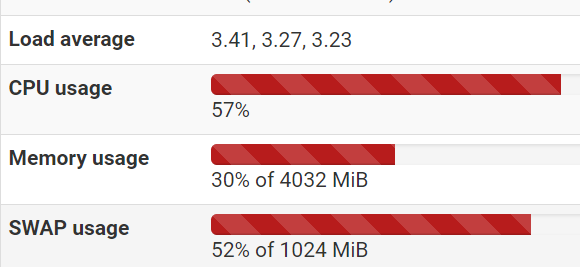
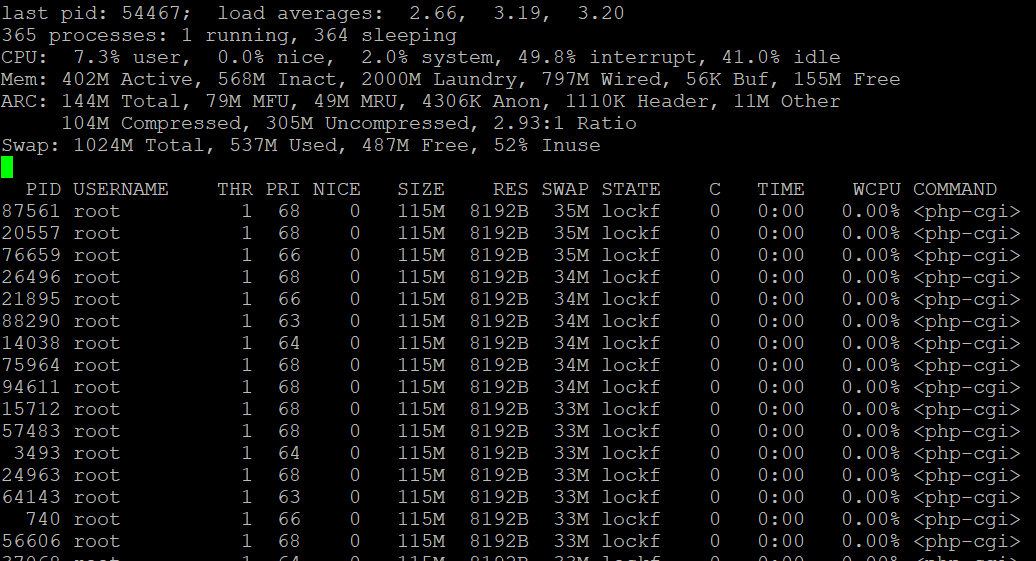
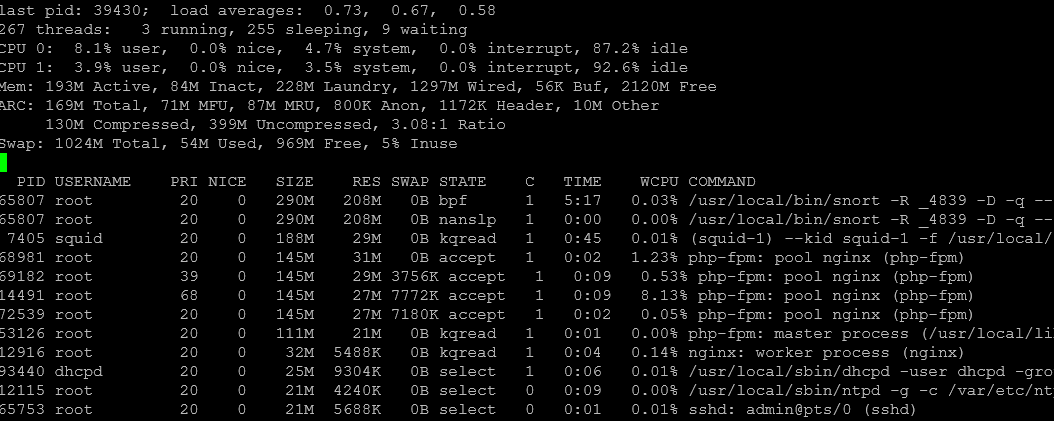
Ran top and see this:
-
Ah, so some stuck script using all the RAM. Interesting.
Try running top as
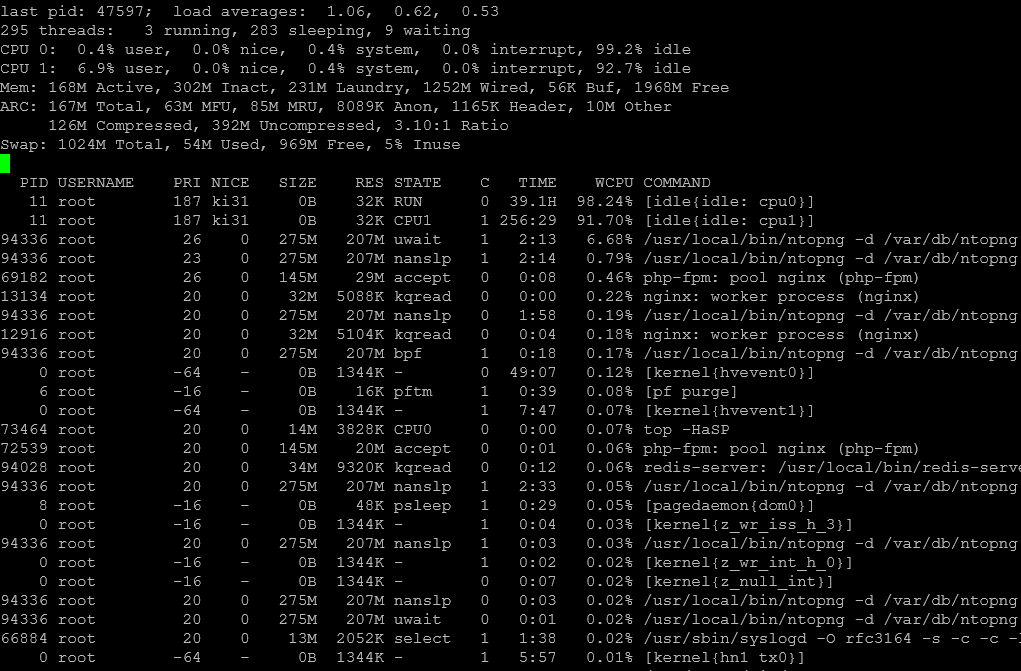
top -HaSPthat may show more.You might also try running
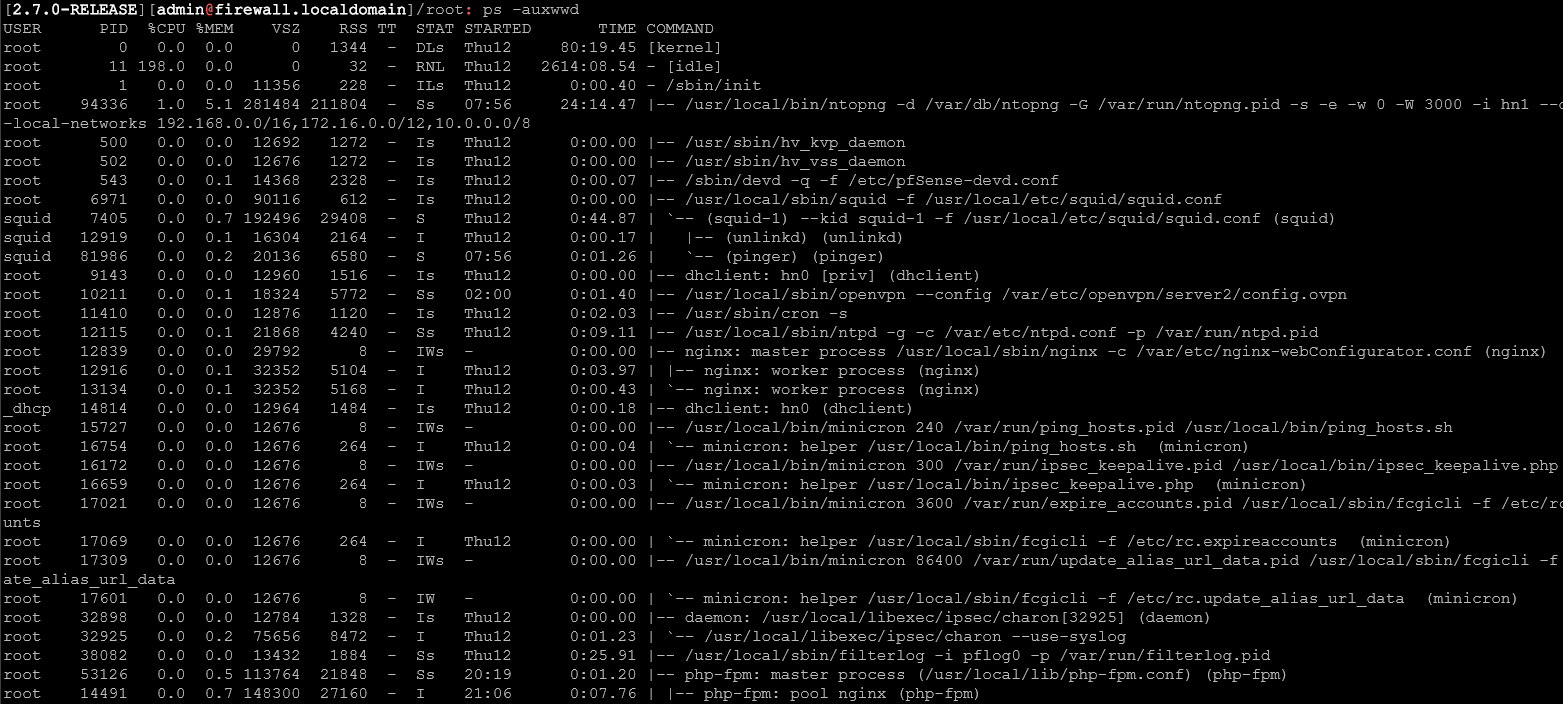
ps -auxwwdthat may show you hat script is running. -
SWAP use is down to 5% a few (15) hours later without my intervention:
Sorted and filtered for Swap:
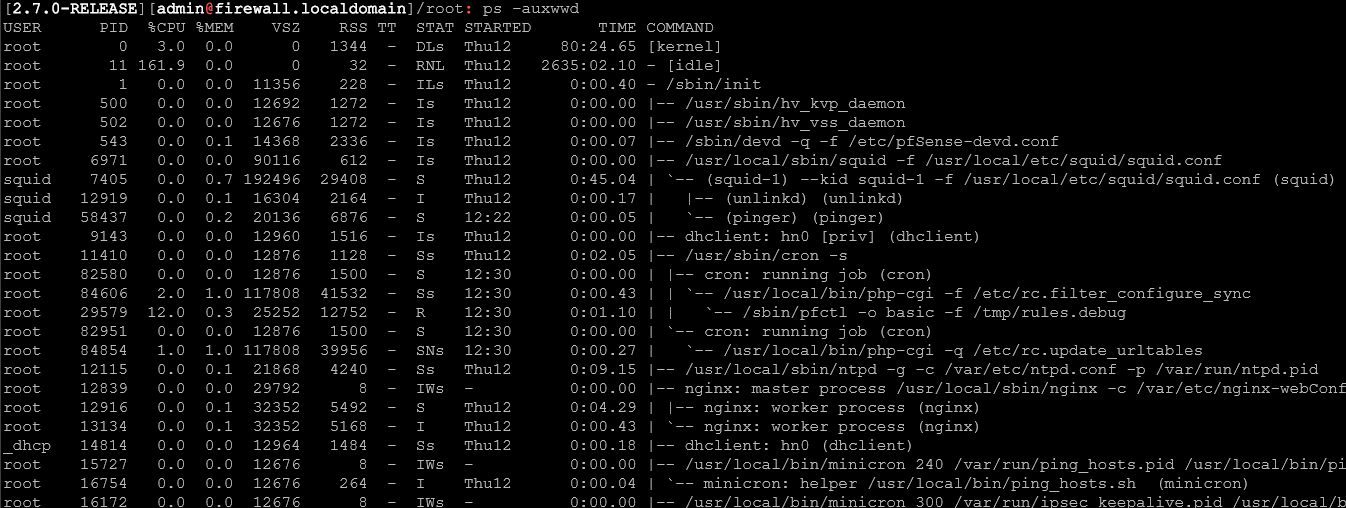
ps -auxwwd results:
Stopped ntopng service and the stats seem similar:
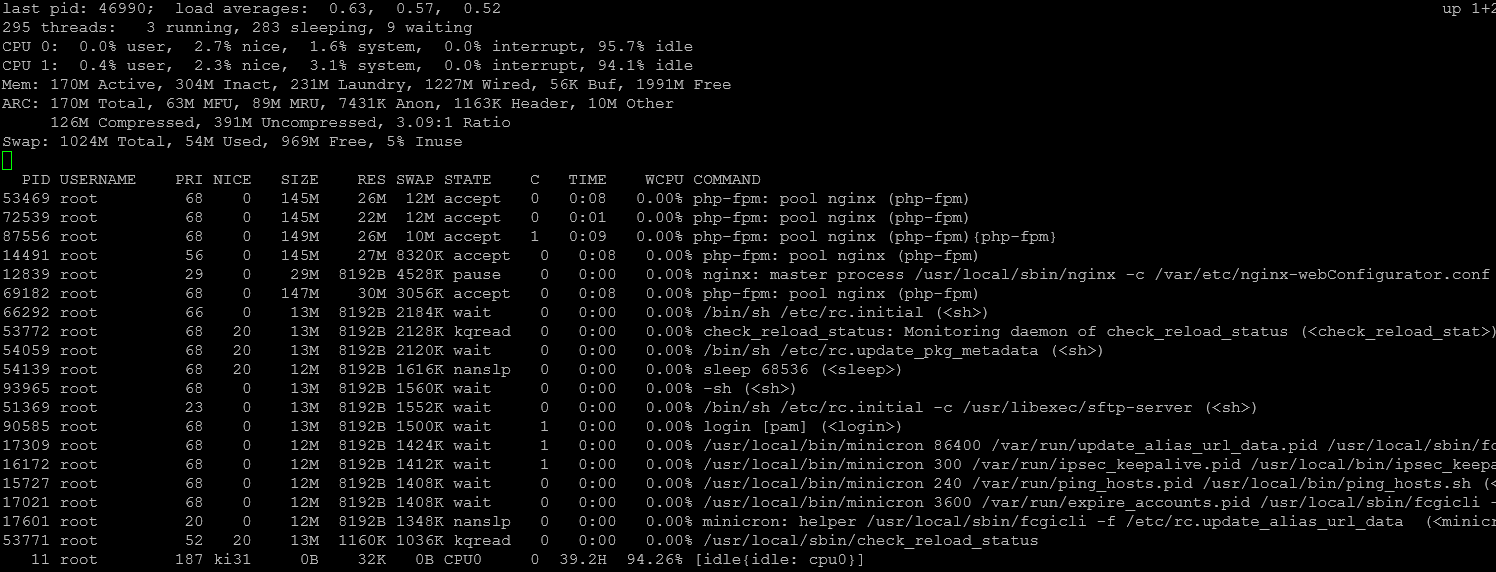
top sorted by size:
top sorted by Swap:
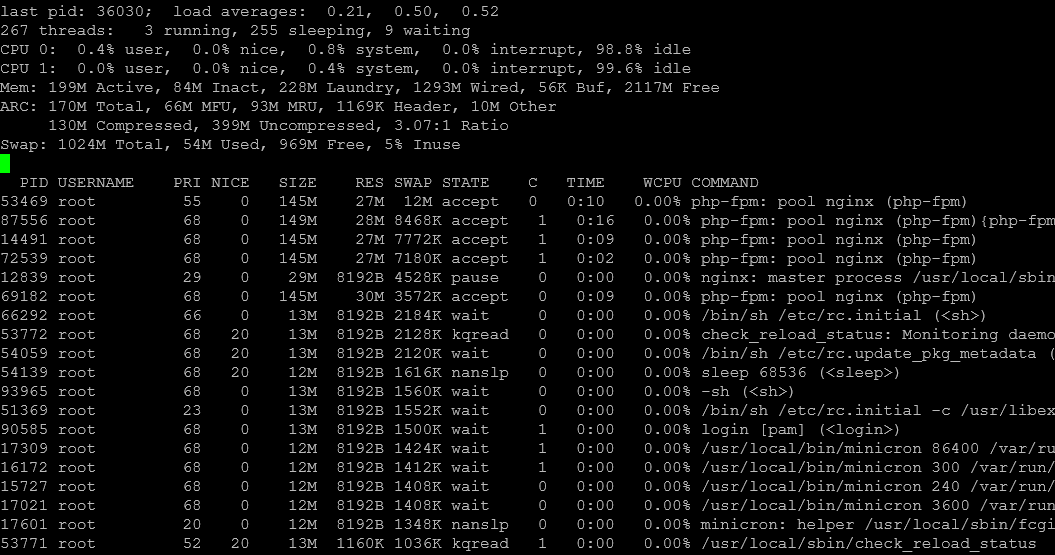
and lastly:
-
Nothing shown in the process tree under php-fpm in the ps output?
-
Not nothing...
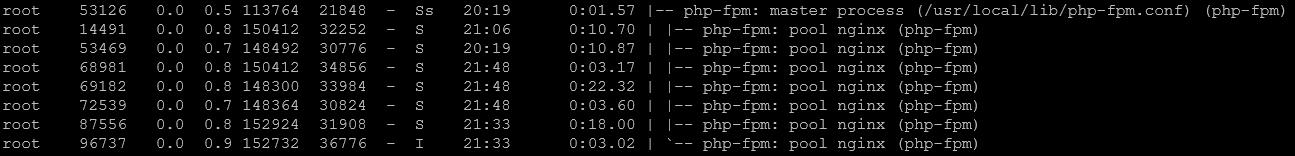
Sorry for truncating that output in the previous message.
-
Hmm, dissapointing, I was hoping it might show there.
I'm not really aware of anything that behaves like that but don't run Hyper-V. You might ask in the virtualisation sub forum.