Cannot Achieve 10g pfsense bottleneck
-
@stephenw10 okay, all the tests done but it was a nightmare
I have done more than disabling lagg
updated the NIC firmware
updated the BIOS
reinstalled the pfsense with uefi boot instead of legacy
set my nic pci to EFI instead of legacy
disabled the laggnow it is a single SFP28 25G DAC cable
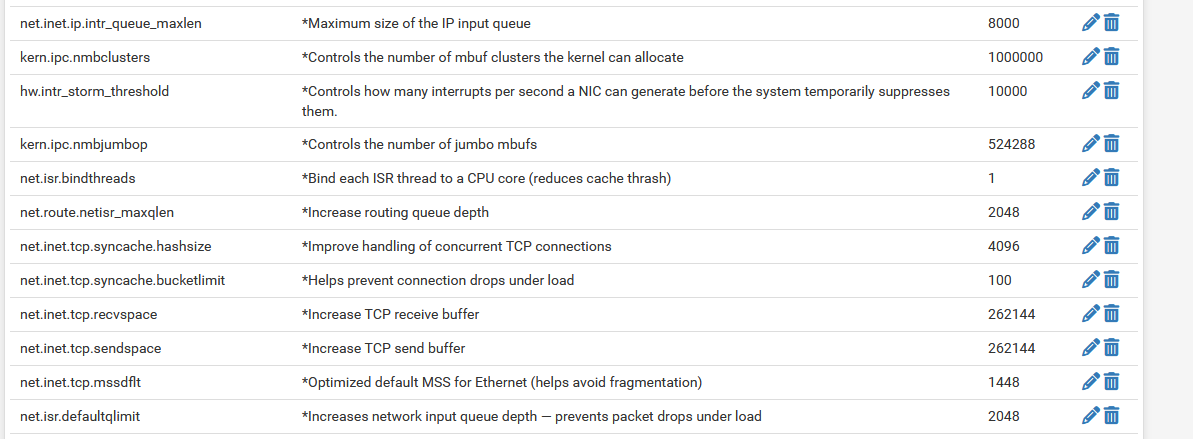
tuned some system variables
enabled Hardware TCP Segmentation Offloading
but still cannot get more than 5g.
Next step would be to use the actual 10g onboard NIC to see if the problem is with the 25G card.
any other troubleshooting steps are welcome
maybe this intel NIC does not play nice with pfsense
-
May I suggest to use jumbo frames if you do not use them already !
I changed every thing within the 10G part of my network including the pfSense lagg related to that to '9000' (netto), which did improve the trough put.
I did start a discussion about that a couple of month ago on the forum.
-
Do you still see one CPU core hitting 100% while the others are 50% idle?
-
@stephenw10 I think it is hitting all the cores.
-
@stephenw10 said in Cannot Achieve 10g pfsense bottleneck:
I wouldn't expect to see much advantage to anything over 8 streams when you have 8 CPU cores.
The CPU has only 4 real cores, the other 4 are SMT placebos, which don't help in term of packet processing. Most likely they slowing things down. I'd suggest to disable SMT / HT at all in the BIOS and configure the NIC queues down to 4. Also Disable any other unneeded features like SR-IOV. My guess is you won't run any VMs on the machine and pass NICs to these.
The Power management configuration of your system affects also the maximum possible throughput. From your first post I can see that your CPU is running on the 2.2GHz base frequency. This is good for constant latency and throughput. Allowing the CPU to scale down the frequency introduces more variance to latency, but it allows to run longer on boost clock (3GHz), which can process more interrupts and make more throughput. Allowing the CPU to scale down, may make things worse. On some systems I had good results in term of throughput, with that on other I don't. It depends on the CPU and NICs.
The last thing I would check is how the interrupt distribution of the nic queues is under network load. As far as I remember you can check this with vmstat -i and systat -vmstat 1
Do you have net.isr.dispatch set to deferred? If yes and you don't have any PPPoE connection in use, you want to try the default dispatcher (direct)
-
@Laxarus
No errors logged anywhere?netstat -I ixl0 -w1 sysctl dev.ixl.0Try some live linux distribution, like Ubuntu, RHEL or Debian or just install pfSense in proxmox, without any pcie pass through, use card ports as virtual switches, one port per switch and test it again with iperf. If you hit the same limit there, you will need to go deeper.
-
@louis2 I tested jumbo frames but did not make any difference and my network have too different speeds so I have to stay at MTU 1500.
@Averlon said in Cannot Achieve 10g pfsense bottleneck:
The CPU has only 4 real cores, the other 4 are SMT placebos, which don't help in term of packet processing. Most likely they slowing things down. I'd suggest to disable SMT / HT at all in the BIOS and configure the NIC queues down to 4. Also Disable any other unneeded features like SR-IOV. My guess is you won't run any VMs on the machine and pass NICs to these.
I tried toggling the SR-IOV, did not see any difference.
Enabled "Extended APIC" and "Above 4G Decoding" is enabled by default.
I did not try disabling SMT/HT or playing with power settings. Currently, it is set to "Energy Efficient" profile, so no custom profiles yet.@Averlon said in Cannot Achieve 10g pfsense bottleneck:
The last thing I would check is how the interrupt distribution of the nic queues is under network load. As far as I remember you can check this with vmstat -i and systat -vmstat 1
It seems evenly distributed to me. (this was during a running iperf3 test)
2 users Load 1.99 2.31 1.79 Oct 25 22:47:13 Mem usage: 8%Phy 5%Kmem VN PAGER SWAP PAGER Mem: REAL VIRTUAL in out in out Tot Share Tot Share Free count 26 Act 685M 62444K 4613G 93312K 28840M pages 39 All 701M 78508K 4614G 366M ioflt Interrupts Proc: 3847 cow 53387 total r p d s w Csw Trp Sys Int Sof Flt 17K zfod 1129 cpu0:timer 320 132K 21K 14K 43K 23K 21K ozfod 1133 cpu1:timer %ozfod 1131 cpu2:timer 10.1%Sys 39.5%Intr 0.9%User 2.5%Nice 47.0%Idle daefr 1129 cpu3:timer | | | | | | | | | | | 19K prcfr 1132 cpu4:timer =====++++++++++++++++++++- 26K totfr 1129 cpu5:timer dtbuf react 1131 cpu6:timer Namei Name-cache Dir-cache 615219 maxvn pdwak 1134 cpu7:timer Calls hits % hits % 4989 numvn 90 pdpgs 23 xhci0 65 4569 4569 100 3402 frevn 33 intrn ixl0:aq 67 1829M wire 7733 ixl0:rxq0 Disks nda0 pass0 pass1 pass2 220M act 5309 ixl0:rxq1 KB/t 0.00 0.00 0.00 0.00 551M inact 18 ixl0:rxq2 tps 0 0 0 0 0 laund 4948 ixl0:rxq3 MB/s 0.00 0.00 0.00 0.00 28G free 7413 ixl0:rxq4 %busy 0 0 0 0 0 buf 7284 ixl0:rxq5 4568 ixl0:rxq6 6949 ixl0:rxq7 nvme0:admi nvme0:io0 nvme0:io1 nvme0:io2 nvme0:io3@Averlon said in Cannot Achieve 10g pfsense bottleneck:
Do you have net.isr.dispatch set to deferred? If yes and you don't have any PPPoE connection in use, you want to try the default dispatcher (direct)
it is set as direct by default, I did not touch that. My WAN is pppoe but I dont test WAN connections anyway.
@w0w said in Cannot Achieve 10g pfsense bottleneck:
No errors logged anywhere?
netstat -I ixl0 -w1
sysctl dev.ixl.0no errors at all.
dev.ixl.0.mac.xoff_recvd: 0
dev.ixl.0.mac.xoff_txd: 0
dev.ixl.0.mac.xon_recvd: 0
dev.ixl.0.mac.xon_txd: 0
dev.ixl.0.mac.tx_frames_big: 0
dev.ixl.0.mac.tx_frames_1024_1522: 375614975
dev.ixl.0.mac.tx_frames_512_1023: 16690370
dev.ixl.0.mac.tx_frames_256_511: 13612270
dev.ixl.0.mac.tx_frames_128_255: 4052150
dev.ixl.0.mac.tx_frames_65_127: 152914345
dev.ixl.0.mac.tx_frames_64: 500265
dev.ixl.0.mac.checksum_errors: 3
dev.ixl.0.mac.rx_jabber: 0
dev.ixl.0.mac.rx_oversized: 0
dev.ixl.0.mac.rx_fragmented: 0
dev.ixl.0.mac.rx_undersize: 0
dev.ixl.0.mac.rx_frames_big: 0
dev.ixl.0.mac.rx_frames_1024_1522: 377904852
dev.ixl.0.mac.rx_frames_512_1023: 16329494
dev.ixl.0.mac.rx_frames_256_511: 14111348
dev.ixl.0.mac.rx_frames_128_255: 3145926
dev.ixl.0.mac.rx_frames_65_127: 138214041
dev.ixl.0.mac.rx_frames_64: 184281
dev.ixl.0.mac.rx_length_errors: 0
dev.ixl.0.mac.remote_faults: 0
dev.ixl.0.mac.local_faults: 2
dev.ixl.0.mac.illegal_bytes: 0
dev.ixl.0.mac.crc_errors: 0
dev.ixl.0.mac.bcast_pkts_txd: 46661
dev.ixl.0.mac.mcast_pkts_txd: 644978
dev.ixl.0.mac.ucast_pkts_txd: 562692736
dev.ixl.0.mac.good_octets_txd: 593759862696
dev.ixl.0.mac.rx_discards: 0
dev.ixl.0.mac.bcast_pkts_rcvd: 75168
dev.ixl.0.mac.mcast_pkts_rcvd: 280282
dev.ixl.0.mac.ucast_pkts_rcvd: 549534492
dev.ixl.0.mac.good_octets_rcvd: 596407236239
dev.ixl.0.pf.txq07.itr: 122
dev.ixl.0.pf.txq07.bytes: 41143051364
dev.ixl.0.pf.txq07.packets: 47973936
dev.ixl.0.pf.txq07.mss_too_small: 0
dev.ixl.0.pf.txq07.tso: 28225
dev.ixl.0.pf.txq06.itr: 122
dev.ixl.0.pf.txq06.bytes: 66474474763
dev.ixl.0.pf.txq06.packets: 57167819
dev.ixl.0.pf.txq06.mss_too_small: 0
dev.ixl.0.pf.txq06.tso: 101247
dev.ixl.0.pf.txq05.itr: 122
dev.ixl.0.pf.txq05.bytes: 87535602506
dev.ixl.0.pf.txq05.packets: 73720437
dev.ixl.0.pf.txq05.mss_too_small: 0
dev.ixl.0.pf.txq05.tso: 365106
dev.ixl.0.pf.txq04.itr: 122
dev.ixl.0.pf.txq04.bytes: 70329303337
dev.ixl.0.pf.txq04.packets: 58308835
dev.ixl.0.pf.txq04.mss_too_small: 0
dev.ixl.0.pf.txq04.tso: 103427
dev.ixl.0.pf.txq03.itr: 122
dev.ixl.0.pf.txq03.bytes: 86678345387
dev.ixl.0.pf.txq03.packets: 77585525
dev.ixl.0.pf.txq03.mss_too_small: 0
dev.ixl.0.pf.txq03.tso: 79961
dev.ixl.0.pf.txq02.itr: 122
dev.ixl.0.pf.txq02.bytes: 63402843222
dev.ixl.0.pf.txq02.packets: 61088681
dev.ixl.0.pf.txq02.mss_too_small: 0
dev.ixl.0.pf.txq02.tso: 133040
dev.ixl.0.pf.txq01.itr: 122
dev.ixl.0.pf.txq01.bytes: 97729964394
dev.ixl.0.pf.txq01.packets: 101429107
dev.ixl.0.pf.txq01.mss_too_small: 0
dev.ixl.0.pf.txq01.tso: 1743
dev.ixl.0.pf.txq00.itr: 122
dev.ixl.0.pf.txq00.bytes: 75454052806
dev.ixl.0.pf.txq00.packets: 78235275
dev.ixl.0.pf.txq00.mss_too_small: 0
dev.ixl.0.pf.txq00.tso: 16482
dev.ixl.0.pf.rxq07.itr: 62
dev.ixl.0.pf.rxq07.desc_err: 0
dev.ixl.0.pf.rxq07.bytes: 42061911478
dev.ixl.0.pf.rxq07.packets: 46161672
dev.ixl.0.pf.rxq07.irqs: 18370252
dev.ixl.0.pf.rxq06.itr: 62
dev.ixl.0.pf.rxq06.desc_err: 0
dev.ixl.0.pf.rxq06.bytes: 65114634180
dev.ixl.0.pf.rxq06.packets: 57147031
dev.ixl.0.pf.rxq06.irqs: 17435678
dev.ixl.0.pf.rxq05.itr: 62
dev.ixl.0.pf.rxq05.desc_err: 0
dev.ixl.0.pf.rxq05.bytes: 83977364285
dev.ixl.0.pf.rxq05.packets: 72607299
dev.ixl.0.pf.rxq05.irqs: 24830962
dev.ixl.0.pf.rxq04.itr: 62
dev.ixl.0.pf.rxq04.desc_err: 0
dev.ixl.0.pf.rxq04.bytes: 70413959352
dev.ixl.0.pf.rxq04.packets: 57951469
dev.ixl.0.pf.rxq04.irqs: 13634250
dev.ixl.0.pf.rxq03.itr: 62
dev.ixl.0.pf.rxq03.desc_err: 0
dev.ixl.0.pf.rxq03.bytes: 88489465483
dev.ixl.0.pf.rxq03.packets: 76718350
dev.ixl.0.pf.rxq03.irqs: 20560555
dev.ixl.0.pf.rxq02.itr: 62
dev.ixl.0.pf.rxq02.desc_err: 0
dev.ixl.0.pf.rxq02.bytes: 64640643506
dev.ixl.0.pf.rxq02.packets: 60418291
dev.ixl.0.pf.rxq02.irqs: 28675547
dev.ixl.0.pf.rxq01.itr: 62
dev.ixl.0.pf.rxq01.desc_err: 0
dev.ixl.0.pf.rxq01.bytes: 73019041590
dev.ixl.0.pf.rxq01.packets: 75989766
dev.ixl.0.pf.rxq01.irqs: 30805377
dev.ixl.0.pf.rxq00.itr: 62
dev.ixl.0.pf.rxq00.desc_err: 0
dev.ixl.0.pf.rxq00.bytes: 104282185425
dev.ixl.0.pf.rxq00.packets: 102756379
dev.ixl.0.pf.rxq00.irqs: 34272354
dev.ixl.0.pf.rx_errors: 3
dev.ixl.0.pf.bcast_pkts_txd: 46661
dev.ixl.0.pf.mcast_pkts_txd: 652008
dev.ixl.0.pf.ucast_pkts_txd: 562692736
dev.ixl.0.pf.good_octets_txd: 591509013288
dev.ixl.0.pf.rx_discards: 4294964835
dev.ixl.0.pf.bcast_pkts_rcvd: 76284
dev.ixl.0.pf.mcast_pkts_rcvd: 142100
dev.ixl.0.pf.ucast_pkts_rcvd: 549533766
dev.ixl.0.pf.good_octets_rcvd: 596393803623
dev.ixl.0.admin_irq: 4
dev.ixl.0.link_active_on_if_down: 1
dev.ixl.0.eee.rx_lpi_count: 0
dev.ixl.0.eee.tx_lpi_count: 0
dev.ixl.0.eee.rx_lpi_status: 0
dev.ixl.0.eee.tx_lpi_status: 0
dev.ixl.0.eee.enable: 0
dev.ixl.0.fw_lldp: 1
dev.ixl.0.fec.auto_fec_enabled: 1
dev.ixl.0.fec.rs_requested: 1
dev.ixl.0.fec.fc_requested: 1
dev.ixl.0.fec.rs_ability: 1
dev.ixl.0.fec.fc_ability: 1
dev.ixl.0.dynamic_tx_itr: 0
dev.ixl.0.dynamic_rx_itr: 0
dev.ixl.0.rx_itr: 62
dev.ixl.0.tx_itr: 122
dev.ixl.0.unallocated_queues: 760
dev.ixl.0.fw_version: fw 9.153.78577 api 1.15 nvm 9.53 etid 8000fcfe oem 1.270.0
dev.ixl.0.current_speed: 25 Gbps
dev.ixl.0.supported_speeds: 22
dev.ixl.0.advertise_speed: 22
dev.ixl.0.fc: 0
dev.ixl.0.iflib.rxq7.rxq_fl0.buf_size: 2048
dev.ixl.0.iflib.rxq7.rxq_fl0.credits: 2047
dev.ixl.0.iflib.rxq7.rxq_fl0.cidx: 1800
dev.ixl.0.iflib.rxq7.rxq_fl0.pidx: 1799
dev.ixl.0.iflib.rxq7.cpu: 6
dev.ixl.0.iflib.rxq6.rxq_fl0.buf_size: 2048
dev.ixl.0.iflib.rxq6.rxq_fl0.credits: 2047
dev.ixl.0.iflib.rxq6.rxq_fl0.cidx: 1693
dev.ixl.0.iflib.rxq6.rxq_fl0.pidx: 1692
dev.ixl.0.iflib.rxq6.cpu: 4
dev.ixl.0.iflib.rxq5.rxq_fl0.buf_size: 2048
dev.ixl.0.iflib.rxq5.rxq_fl0.credits: 2047
dev.ixl.0.iflib.rxq5.rxq_fl0.cidx: 1603
dev.ixl.0.iflib.rxq5.rxq_fl0.pidx: 1602
dev.ixl.0.iflib.rxq5.cpu: 2
dev.ixl.0.iflib.rxq4.rxq_fl0.buf_size: 2048
dev.ixl.0.iflib.rxq4.rxq_fl0.credits: 2047
dev.ixl.0.iflib.rxq4.rxq_fl0.cidx: 1261
dev.ixl.0.iflib.rxq4.rxq_fl0.pidx: 1260
dev.ixl.0.iflib.rxq4.cpu: 0
dev.ixl.0.iflib.rxq3.rxq_fl0.buf_size: 2048
dev.ixl.0.iflib.rxq3.rxq_fl0.credits: 2047
dev.ixl.0.iflib.rxq3.rxq_fl0.cidx: 270
dev.ixl.0.iflib.rxq3.rxq_fl0.pidx: 269
dev.ixl.0.iflib.rxq3.cpu: 6
dev.ixl.0.iflib.rxq2.rxq_fl0.buf_size: 2048
dev.ixl.0.iflib.rxq2.rxq_fl0.credits: 2047
dev.ixl.0.iflib.rxq2.rxq_fl0.cidx: 243
dev.ixl.0.iflib.rxq2.rxq_fl0.pidx: 242
dev.ixl.0.iflib.rxq2.cpu: 4
dev.ixl.0.iflib.rxq1.rxq_fl0.buf_size: 2048
dev.ixl.0.iflib.rxq1.rxq_fl0.credits: 2047
dev.ixl.0.iflib.rxq1.rxq_fl0.cidx: 774
dev.ixl.0.iflib.rxq1.rxq_fl0.pidx: 773
dev.ixl.0.iflib.rxq1.cpu: 2
dev.ixl.0.iflib.rxq0.rxq_fl0.buf_size: 2048
dev.ixl.0.iflib.rxq0.rxq_fl0.credits: 2047
dev.ixl.0.iflib.rxq0.rxq_fl0.cidx: 27
dev.ixl.0.iflib.rxq0.rxq_fl0.pidx: 26
dev.ixl.0.iflib.rxq0.cpu: 0
dev.ixl.0.iflib.txq7.r_abdications: 0
dev.ixl.0.iflib.txq7.r_restarts: 0
dev.ixl.0.iflib.txq7.r_stalls: 0
dev.ixl.0.iflib.txq7.r_starts: 47971641
dev.ixl.0.iflib.txq7.r_drops: 0
dev.ixl.0.iflib.txq7.r_enqueues: 48007467
dev.ixl.0.iflib.txq7.ring_state: pidx_head: 0299 pidx_tail: 0299 cidx: 0299 state: IDLE
dev.ixl.0.iflib.txq7.txq_cleaned: 48236471
dev.ixl.0.iflib.txq7.txq_processed: 48236479
dev.ixl.0.iflib.txq7.txq_in_use: 8
dev.ixl.0.iflib.txq7.txq_cidx_processed: 1983
dev.ixl.0.iflib.txq7.txq_cidx: 1975
dev.ixl.0.iflib.txq7.txq_pidx: 1983
dev.ixl.0.iflib.txq7.no_tx_dma_setup: 0
dev.ixl.0.iflib.txq7.txd_encap_efbig: 0
dev.ixl.0.iflib.txq7.tx_map_failed: 0
dev.ixl.0.iflib.txq7.no_desc_avail: 0
dev.ixl.0.iflib.txq7.mbuf_defrag_failed: 0
dev.ixl.0.iflib.txq7.m_pullups: 1377
dev.ixl.0.iflib.txq7.mbuf_defrag: 0
dev.ixl.0.iflib.txq7.cpu: 6
dev.ixl.0.iflib.txq6.r_abdications: 0
dev.ixl.0.iflib.txq6.r_restarts: 0
dev.ixl.0.iflib.txq6.r_stalls: 0
dev.ixl.0.iflib.txq6.r_starts: 57165056
dev.ixl.0.iflib.txq6.r_drops: 0
dev.ixl.0.iflib.txq6.r_enqueues: 57232644
dev.ixl.0.iflib.txq6.ring_state: pidx_head: 1285 pidx_tail: 1285 cidx: 1285 state: IDLE
dev.ixl.0.iflib.txq6.txq_cleaned: 57913397
dev.ixl.0.iflib.txq6.txq_processed: 57913406
dev.ixl.0.iflib.txq6.txq_in_use: 9
dev.ixl.0.iflib.txq6.txq_cidx_processed: 65
dev.ixl.0.iflib.txq6.txq_cidx: 58
dev.ixl.0.iflib.txq6.txq_pidx: 68
dev.ixl.0.iflib.txq6.no_tx_dma_setup: 0
dev.ixl.0.iflib.txq6.txd_encap_efbig: 0
dev.ixl.0.iflib.txq6.tx_map_failed: 0
dev.ixl.0.iflib.txq6.no_desc_avail: 0
dev.ixl.0.iflib.txq6.mbuf_defrag_failed: 0
dev.ixl.0.iflib.txq6.m_pullups: 127
dev.ixl.0.iflib.txq6.mbuf_defrag: 0
dev.ixl.0.iflib.txq6.cpu: 4
dev.ixl.0.iflib.txq5.r_abdications: 0
dev.ixl.0.iflib.txq5.r_restarts: 0
dev.ixl.0.iflib.txq5.r_stalls: 0
dev.ixl.0.iflib.txq5.r_starts: 73716508
dev.ixl.0.iflib.txq5.r_drops: 0
dev.ixl.0.iflib.txq5.r_enqueues: 73782066
dev.ixl.0.iflib.txq5.ring_state: pidx_head: 0818 pidx_tail: 0818 cidx: 0818 state: IDLE
dev.ixl.0.iflib.txq5.txq_cleaned: 76713335
dev.ixl.0.iflib.txq5.txq_processed: 76713343
dev.ixl.0.iflib.txq5.txq_in_use: 8
dev.ixl.0.iflib.txq5.txq_cidx_processed: 1407
dev.ixl.0.iflib.txq5.txq_cidx: 1399
dev.ixl.0.iflib.txq5.txq_pidx: 1407
dev.ixl.0.iflib.txq5.no_tx_dma_setup: 0
dev.ixl.0.iflib.txq5.txd_encap_efbig: 0
dev.ixl.0.iflib.txq5.tx_map_failed: 0
dev.ixl.0.iflib.txq5.no_desc_avail: 0
dev.ixl.0.iflib.txq5.mbuf_defrag_failed: 0
dev.ixl.0.iflib.txq5.m_pullups: 716
dev.ixl.0.iflib.txq5.mbuf_defrag: 0
dev.ixl.0.iflib.txq5.cpu: 2
dev.ixl.0.iflib.txq4.r_abdications: 0
dev.ixl.0.iflib.txq4.r_restarts: 0
dev.ixl.0.iflib.txq4.r_stalls: 0
dev.ixl.0.iflib.txq4.r_starts: 58307559
dev.ixl.0.iflib.txq4.r_drops: 0
dev.ixl.0.iflib.txq4.r_enqueues: 58369606
dev.ixl.0.iflib.txq4.ring_state: pidx_head: 1606 pidx_tail: 1606 cidx: 1606 state: IDLE
dev.ixl.0.iflib.txq4.txq_cleaned: 59003490
dev.ixl.0.iflib.txq4.txq_processed: 59003498
dev.ixl.0.iflib.txq4.txq_in_use: 8
dev.ixl.0.iflib.txq4.txq_cidx_processed: 618
dev.ixl.0.iflib.txq4.txq_cidx: 610
dev.ixl.0.iflib.txq4.txq_pidx: 618
dev.ixl.0.iflib.txq4.no_tx_dma_setup: 0
dev.ixl.0.iflib.txq4.txd_encap_efbig: 0
dev.ixl.0.iflib.txq4.tx_map_failed: 0
dev.ixl.0.iflib.txq4.no_desc_avail: 0
dev.ixl.0.iflib.txq4.mbuf_defrag_failed: 0
dev.ixl.0.iflib.txq4.m_pullups: 86
dev.ixl.0.iflib.txq4.mbuf_defrag: 0
dev.ixl.0.iflib.txq4.cpu: 0
dev.ixl.0.iflib.txq3.r_abdications: 0
dev.ixl.0.iflib.txq3.r_restarts: 0
dev.ixl.0.iflib.txq3.r_stalls: 0
dev.ixl.0.iflib.txq3.r_starts: 77583619
dev.ixl.0.iflib.txq3.r_drops: 0
dev.ixl.0.iflib.txq3.r_enqueues: 77663516
dev.ixl.0.iflib.txq3.ring_state: pidx_head: 1308 pidx_tail: 1308 cidx: 1308 state: IDLE
dev.ixl.0.iflib.txq3.txq_cleaned: 78294052
dev.ixl.0.iflib.txq3.txq_processed: 78294060
dev.ixl.0.iflib.txq3.txq_in_use: 8
dev.ixl.0.iflib.txq3.txq_cidx_processed: 1068
dev.ixl.0.iflib.txq3.txq_cidx: 1060
dev.ixl.0.iflib.txq3.txq_pidx: 1068
dev.ixl.0.iflib.txq3.no_tx_dma_setup: 0
dev.ixl.0.iflib.txq3.txd_encap_efbig: 0
dev.ixl.0.iflib.txq3.tx_map_failed: 0
dev.ixl.0.iflib.txq3.no_desc_avail: 0
dev.ixl.0.iflib.txq3.mbuf_defrag_failed: 0
dev.ixl.0.iflib.txq3.m_pullups: 409
dev.ixl.0.iflib.txq3.mbuf_defrag: 0
dev.ixl.0.iflib.txq3.cpu: 6
dev.ixl.0.iflib.txq2.r_abdications: 0
dev.ixl.0.iflib.txq2.r_restarts: 0
dev.ixl.0.iflib.txq2.r_stalls: 0
dev.ixl.0.iflib.txq2.r_starts: 61084731
dev.ixl.0.iflib.txq2.r_drops: 0
dev.ixl.0.iflib.txq2.r_enqueues: 61139632
dev.ixl.0.iflib.txq2.ring_state: pidx_head: 0688 pidx_tail: 0688 cidx: 0688 state: IDLE
dev.ixl.0.iflib.txq2.txq_cleaned: 61925883
dev.ixl.0.iflib.txq2.txq_processed: 61925891
dev.ixl.0.iflib.txq2.txq_in_use: 8
dev.ixl.0.iflib.txq2.txq_cidx_processed: 515
dev.ixl.0.iflib.txq2.txq_cidx: 507
dev.ixl.0.iflib.txq2.txq_pidx: 515
dev.ixl.0.iflib.txq2.no_tx_dma_setup: 0
dev.ixl.0.iflib.txq2.txd_encap_efbig: 0
dev.ixl.0.iflib.txq2.tx_map_failed: 0
dev.ixl.0.iflib.txq2.no_desc_avail: 0
dev.ixl.0.iflib.txq2.mbuf_defrag_failed: 0
dev.ixl.0.iflib.txq2.m_pullups: 550
dev.ixl.0.iflib.txq2.mbuf_defrag: 0
dev.ixl.0.iflib.txq2.cpu: 4
dev.ixl.0.iflib.txq1.r_abdications: 0
dev.ixl.0.iflib.txq1.r_restarts: 0
dev.ixl.0.iflib.txq1.r_stalls: 0
dev.ixl.0.iflib.txq1.r_starts: 101436836
dev.ixl.0.iflib.txq1.r_drops: 0
dev.ixl.0.iflib.txq1.r_enqueues: 101537592
dev.ixl.0.iflib.txq1.ring_state: pidx_head: 1848 pidx_tail: 1848 cidx: 1848 state: IDLE
dev.ixl.0.iflib.txq1.txq_cleaned: 101552637
dev.ixl.0.iflib.txq1.txq_processed: 101552645
dev.ixl.0.iflib.txq1.txq_in_use: 8
dev.ixl.0.iflib.txq1.txq_cidx_processed: 517
dev.ixl.0.iflib.txq1.txq_cidx: 509
dev.ixl.0.iflib.txq1.txq_pidx: 517
dev.ixl.0.iflib.txq1.no_tx_dma_setup: 0
dev.ixl.0.iflib.txq1.txd_encap_efbig: 0
dev.ixl.0.iflib.txq1.tx_map_failed: 0
dev.ixl.0.iflib.txq1.no_desc_avail: 0
dev.ixl.0.iflib.txq1.mbuf_defrag_failed: 0
dev.ixl.0.iflib.txq1.m_pullups: 1089
dev.ixl.0.iflib.txq1.mbuf_defrag: 0
dev.ixl.0.iflib.txq1.cpu: 2
dev.ixl.0.iflib.txq0.r_abdications: 1
dev.ixl.0.iflib.txq0.r_restarts: 0
dev.ixl.0.iflib.txq0.r_stalls: 0
dev.ixl.0.iflib.txq0.r_starts: 78227423
dev.ixl.0.iflib.txq0.r_drops: 0
dev.ixl.0.iflib.txq0.r_enqueues: 78277869
dev.ixl.0.iflib.txq0.ring_state: pidx_head: 1261 pidx_tail: 1261 cidx: 1261 state: IDLE
dev.ixl.0.iflib.txq0.txq_cleaned: 78508028
dev.ixl.0.iflib.txq0.txq_processed: 78508036
dev.ixl.0.iflib.txq0.txq_in_use: 8
dev.ixl.0.iflib.txq0.txq_cidx_processed: 4
dev.ixl.0.iflib.txq0.txq_cidx: 2044
dev.ixl.0.iflib.txq0.txq_pidx: 4
dev.ixl.0.iflib.txq0.no_tx_dma_setup: 0
dev.ixl.0.iflib.txq0.txd_encap_efbig: 0
dev.ixl.0.iflib.txq0.tx_map_failed: 0
dev.ixl.0.iflib.txq0.no_desc_avail: 0
dev.ixl.0.iflib.txq0.mbuf_defrag_failed: 0
dev.ixl.0.iflib.txq0.m_pullups: 484
dev.ixl.0.iflib.txq0.mbuf_defrag: 0
dev.ixl.0.iflib.txq0.cpu: 0
dev.ixl.0.iflib.override_nrxds: 2048
dev.ixl.0.iflib.override_ntxds: 2048
dev.ixl.0.iflib.allocated_msix_vectors: 9
dev.ixl.0.iflib.use_extra_msix_vectors: 0
dev.ixl.0.iflib.use_logical_cores: 0
dev.ixl.0.iflib.separate_txrx: 0
dev.ixl.0.iflib.core_offset: 0
dev.ixl.0.iflib.tx_abdicate: 0
dev.ixl.0.iflib.rx_budget: 0
dev.ixl.0.iflib.disable_msix: 0
dev.ixl.0.iflib.override_qs_enable: 0
dev.ixl.0.iflib.override_nrxqs: 8
dev.ixl.0.iflib.override_ntxqs: 8
dev.ixl.0.iflib.driver_version: 2.3.3-k
dev.ixl.0.%domain: 0
dev.ixl.0.%iommu: rid=0x6500
dev.ixl.0.%parent: pci7
dev.ixl.0.%pnpinfo: vendor=0x8086 device=0x158b subvendor=0x15d9 subdevice=0x0978 class=0x020000
dev.ixl.0.%location: slot=0 function=0 dbsf=pci0:101:0:0
dev.ixl.0.%driver: ixl
dev.ixl.0.%desc: Intel(R) Ethernet Controller XXV710 for 25GbE SFP28 - 2.3.3-k
is it possible that there are too many vlans on the network and too many rules/packets to process with my cpu during high speed transfer spikes?
Currently 13 vlans + LAN on the same cable with various rules. -
@Laxarus said in Cannot Achieve 10g pfsense bottleneck:
Currently 13 vlans + LAN on the same cable with various rules.
It doesn't sound like serious load.
-
What's the traffic like on the other VLAN's, etc. If it's low it shouldn't have much impact ?
What PfSense Rules are on the VLAN's that have the iperf3 client & server ?
Also, what managed switch are you using on the PfSense LAN & VLAN side ?
-
Another thought. Your tests are using iperf3 TCP, so not only are the flows are up & down the same 25G connection, there's also the reverse SYN & ACK going over the same pipe as your traffic.
Definitely try UDP but you might need to specify UDP on the server as well as client side.
-
I’d test the firewall hardware by installing Proxmox on it and running pfSense with the NICs as virtual devices. Even virtualized, I tested my Intel X710-T4L on the pfSense LAN with an N100 CPU and the card in an x4 PCIe slot. Even in that setup, iperf reaches 6–7 Gbps.
-
@Averlon said in Cannot Achieve 10g pfsense bottleneck:
From your first post I can see that your CPU is running on the 2.2GHz base frequency. This is good for constant latency and throughput. Allowing the CPU to scale down the frequency introduces more variance to latency, but it allows to run longer on boost clock (3GHz), which can process more interrupts and make more throughput.
The max value shown there of 2201 means that Turbo is enabled. It never actually shows the turbo speed on a speed-step enabled CPU. But it could be hitting some thermal/power limit perhaps I agree. Though I'd expect to see some spikes above the 5Gbps if that was the case. At least some variation between repeated tests.
-
@stephenw10 It's not about Turbo is enabled or not, it's about power management in general, since it is one of many factors affecting throughput of the platform and it wasn't considered yet. Too aggressive power saving settings can also lead to performance degradations.
-
Thank you all for suggestions
@pwood999 said in Cannot Achieve 10g pfsense bottleneck:
What's the traffic like on the other VLAN's, etc. If it's low it shouldn't have much impact ?
there is not much file transfer traffic on L3. Generally chatter.
@pwood999 said in Cannot Achieve 10g pfsense bottleneck:
What PfSense Rules are on the VLAN's that have the iperf3 client & server ?
For testing purposes, I allowed all traffic.
@pwood999 said in Cannot Achieve 10g pfsense bottleneck:
Also, what managed switch are you using on the PfSense LAN & VLAN side ?
All unifi switches, but I have no problem getting 10G on L2 so I have ruled out the switches as the problem.
@w0w said in Cannot Achieve 10g pfsense bottleneck:
I’d test the firewall hardware by installing Proxmox on it and running pfSense with the NICs as virtual devices. Even virtualized, I tested my Intel X710-T4L on the pfSense LAN with an N100 CPU and the card in an x4 PCIe slot. Even in that setup, iperf reaches 6–7 Gbps.
I cannot afford testing this hardware in a virtual environment. This is currently in production and there is no backup for it.
@pwood999 said in Cannot Achieve 10g pfsense bottleneck:
Definitely try UDP but you might need to specify UDP on the server as well as client side.
Good point. Testing with UDP I got very interesting results.
root@PROXMOX1:~# iperf3 -c 192.168.40.40 -u -b 9.5G -t 10 -l 1472 --get-server-output -P 4
warning: UDP block size 1472 exceeds TCP MSS 1448, may result in fragmentation / drops
Connecting to host 192.168.40.40, port 5201
[  5] local 192.168.55.21 port 53975 connected to 192.168.40.40 port 5201
[  7] local 192.168.55.21 port 36922 connected to 192.168.40.40 port 5201
[  9] local 192.168.55.21 port 57106 connected to 192.168.40.40 port 5201
[ 11] local 192.168.55.21 port 43050 connected to 192.168.40.40 port 5201
[ ID] Interval           Transfer     Bitrate         Total Datagrams
[  5]   0.00-1.00   sec   285 MBytes  2.39 Gbits/sec  203373
[  7]   0.00-1.00   sec   286 MBytes  2.39 Gbits/sec  203512
[  9]   0.00-1.00   sec   286 MBytes  2.39 Gbits/sec  203515
[ 11]   0.00-1.00   sec   285 MBytes  2.39 Gbits/sec  203332
[SUM]   0.00-1.00   sec  1.12 GBytes  9.57 Gbits/sec  813732
- - - - - - - - - - - - - - - - - - - - - - - - -
[  5]   1.00-2.00   sec   285 MBytes  2.39 Gbits/sec  203224
[  7]   1.00-2.00   sec   285 MBytes  2.39 Gbits/sec  203205
[  9]   1.00-2.00   sec   285 MBytes  2.39 Gbits/sec  203122
[ 11]   1.00-2.00   sec   285 MBytes  2.39 Gbits/sec  203127
[SUM]   1.00-2.00   sec  1.11 GBytes  9.57 Gbits/sec  812678
- - - - - - - - - - - - - - - - - - - - - - - - -
[  5]   2.00-3.00   sec   285 MBytes  2.39 Gbits/sec  203131
[  7]   2.00-3.00   sec   285 MBytes  2.39 Gbits/sec  203188
[  9]   2.00-3.00   sec   285 MBytes  2.39 Gbits/sec  203161
[ 11]   2.00-3.00   sec   285 MBytes  2.39 Gbits/sec  203165
[SUM]   2.00-3.00   sec  1.11 GBytes  9.57 Gbits/sec  812645
- - - - - - - - - - - - - - - - - - - - - - - - -
[  5]   3.00-4.00   sec   285 MBytes  2.39 Gbits/sec  203180
[  7]   3.00-4.00   sec   285 MBytes  2.39 Gbits/sec  203170
[  9]   3.00-4.00   sec   285 MBytes  2.39 Gbits/sec  203211
[ 11]   3.00-4.00   sec   285 MBytes  2.39 Gbits/sec  203119
[SUM]   3.00-4.00   sec  1.11 GBytes  9.57 Gbits/sec  812680
- - - - - - - - - - - - - - - - - - - - - - - - -
[  5]   4.00-5.00   sec   285 MBytes  2.39 Gbits/sec  203136
[  7]   4.00-5.00   sec   285 MBytes  2.39 Gbits/sec  203126
[  9]   4.00-5.00   sec   285 MBytes  2.39 Gbits/sec  203134
[ 11]   4.00-5.00   sec   285 MBytes  2.39 Gbits/sec  203145
[SUM]   4.00-5.00   sec  1.11 GBytes  9.57 Gbits/sec  812541
- - - - - - - - - - - - - - - - - - - - - - - - -
[  5]   5.00-6.00   sec   285 MBytes  2.39 Gbits/sec  203125
[  7]   5.00-6.00   sec   285 MBytes  2.39 Gbits/sec  203171
[  9]   5.00-6.00   sec   285 MBytes  2.39 Gbits/sec  203162
[ 11]   5.00-6.00   sec   285 MBytes  2.39 Gbits/sec  203157
[SUM]   5.00-6.00   sec  1.11 GBytes  9.57 Gbits/sec  812615
- - - - - - - - - - - - - - - - - - - - - - - - -
[  5]   6.00-7.00   sec   285 MBytes  2.39 Gbits/sec  203178
[  7]   6.00-7.00   sec   285 MBytes  2.39 Gbits/sec  203207
[  9]   6.00-7.00   sec   285 MBytes  2.39 Gbits/sec  203174
[ 11]   6.00-7.00   sec   285 MBytes  2.39 Gbits/sec  203166
[SUM]   6.00-7.00   sec  1.11 GBytes  9.57 Gbits/sec  812725
- - - - - - - - - - - - - - - - - - - - - - - - -
[  5]   7.00-8.00   sec   285 MBytes  2.39 Gbits/sec  203199
[  7]   7.00-8.00   sec   285 MBytes  2.39 Gbits/sec  203171
[  9]   7.00-8.00   sec   285 MBytes  2.39 Gbits/sec  203138
[ 11]   7.00-8.00   sec   285 MBytes  2.39 Gbits/sec  203196
[SUM]   7.00-8.00   sec  1.11 GBytes  9.57 Gbits/sec  812704
- - - - - - - - - - - - - - - - - - - - - - - - -
[  5]   8.00-9.00   sec   285 MBytes  2.39 Gbits/sec  203085
[  7]   8.00-9.00   sec   285 MBytes  2.39 Gbits/sec  203155
[  9]   8.00-9.00   sec   285 MBytes  2.39 Gbits/sec  203137
[ 11]   8.00-9.00   sec   285 MBytes  2.39 Gbits/sec  203124
[SUM]   8.00-9.00   sec  1.11 GBytes  9.57 Gbits/sec  812501
- - - - - - - - - - - - - - - - - - - - - - - - -
[  5]   9.00-10.00  sec   285 MBytes  2.39 Gbits/sec  203169
[  7]   9.00-10.00  sec   285 MBytes  2.39 Gbits/sec  203196
[  9]   9.00-10.00  sec   285 MBytes  2.39 Gbits/sec  203177
[ 11]   9.00-10.00  sec   285 MBytes  2.39 Gbits/sec  203195
[SUM]   9.00-10.00  sec  1.11 GBytes  9.56 Gbits/sec  812737
- - - - - - - - - - - - - - - - - - - - - - - - -
[ ID] Interval           Transfer     Bitrate         Jitter    Lost/Total Datagrams
[  5]   0.00-10.00  sec  2.79 GBytes  2.39 Gbits/sec  0.000 ms  0/2031800 (0%)  sender
[  5]   0.00-10.00  sec  1.18 GBytes  1.01 Gbits/sec  0.011 ms  1170176/2030971 (58%)  receiver
[  7]   0.00-10.00  sec  2.79 GBytes  2.39 Gbits/sec  0.000 ms  0/2032101 (0%)  sender
[  7]   0.00-10.00  sec  1.19 GBytes  1.02 Gbits/sec  0.018 ms  1163621/2031264 (57%)  receiver
[  9]   0.00-10.00  sec  2.79 GBytes  2.39 Gbits/sec  0.000 ms  0/2031931 (0%)  sender
[  9]   0.00-10.00  sec  1.17 GBytes  1.01 Gbits/sec  0.010 ms  1175570/2031116 (58%)  receiver
[ 11]   0.00-10.00  sec  2.79 GBytes  2.39 Gbits/sec  0.000 ms  0/2031726 (0%)  sender
[ 11]   0.00-10.00  sec  1.15 GBytes   991 Mbits/sec  0.011 ms  1189040/2030907 (59%)  receiver
[SUM]   0.00-10.00  sec  11.1 GBytes  9.57 Gbits/sec  0.000 ms  0/8127558 (0%)  sender
[SUM]   0.00-10.00  sec  4.70 GBytes  4.03 Gbits/sec  0.012 ms  4698407/8124258 (58%)  receiver

Server output:
-----------------------------------------------------------
Server listening on 5201 (test #3)
-----------------------------------------------------------
Accepted connection from 192.168.55.21, port 33208
[  5] local 192.168.40.40 port 5201 connected to 192.168.55.21 port 53975
[  6] local 192.168.40.40 port 5201 connected to 192.168.55.21 port 36922
[  9] local 192.168.40.40 port 5201 connected to 192.168.55.21 port 57106
[ 11] local 192.168.40.40 port 5201 connected to 192.168.55.21 port 43050
[ ID] Interval           Transfer     Bitrate         Jitter    Lost/Total Datagrams
[  5]   0.00-1.00   sec   120 MBytes  1.01 Gbits/sec  0.008 ms  116792/202427 (58%)
[  6]   0.00-1.00   sec   122 MBytes  1.02 Gbits/sec  0.011 ms  115872/202564 (57%)
[  9]   0.00-1.00   sec   118 MBytes   985 Mbits/sec  0.009 ms  118800/202535 (59%)
[ 11]   0.00-1.00   sec   115 MBytes   963 Mbits/sec  0.020 ms  120523/202367 (60%)
[SUM]   0.00-1.00   sec   474 MBytes  3.98 Gbits/sec  0.012 ms  471987/809893 (58%)
- - - - - - - - - - - - - - - - - - - - - - - - -
[  5]   1.00-2.00   sec   122 MBytes  1.02 Gbits/sec  0.010 ms  116048/203048 (57%)
[  6]   1.00-2.00   sec   120 MBytes  1.01 Gbits/sec  0.010 ms  117649/203048 (58%)
[  9]   1.00-2.00   sec   115 MBytes   967 Mbits/sec  0.013 ms  120927/203008 (60%)
[ 11]   1.00-2.00   sec   114 MBytes   959 Mbits/sec  0.019 ms  121594/202996 (60%)
[SUM]   1.00-2.00   sec   472 MBytes  3.96 Gbits/sec  0.013 ms  476218/812100 (59%)
- - - - - - - - - - - - - - - - - - - - - - - - -
[  5]   2.00-3.00   sec   122 MBytes  1.02 Gbits/sec  0.014 ms  116649/203371 (57%)
[  6]   2.00-3.00   sec   123 MBytes  1.03 Gbits/sec  0.012 ms  115793/203379 (57%)
[  9]   2.00-3.00   sec   121 MBytes  1.01 Gbits/sec  0.010 ms  117380/203379 (58%)
[ 11]   2.00-3.00   sec   112 MBytes   939 Mbits/sec  0.011 ms  123560/203353 (61%)
[SUM]   2.00-3.00   sec   477 MBytes  4.00 Gbits/sec  0.012 ms  473382/813482 (58%)
- - - - - - - - - - - - - - - - - - - - - - - - -
[  5]   3.00-4.00   sec   123 MBytes  1.03 Gbits/sec  0.013 ms  115535/203161 (57%)
[  6]   3.00-4.00   sec   123 MBytes  1.03 Gbits/sec  0.011 ms  115716/203181 (57%)
[  9]   3.00-4.00   sec   119 MBytes   997 Mbits/sec  0.012 ms  118496/203183 (58%)
[ 11]   3.00-4.00   sec   117 MBytes   982 Mbits/sec  0.013 ms  119764/203121 (59%)
[SUM]   3.00-4.00   sec   482 MBytes  4.04 Gbits/sec  0.012 ms  469511/812646 (58%)
- - - - - - - - - - - - - - - - - - - - - - - - -
[  5]   4.00-5.00   sec   122 MBytes  1.02 Gbits/sec  0.014 ms  116366/203129 (57%)
[  6]   4.00-5.00   sec   123 MBytes  1.03 Gbits/sec  0.022 ms  115463/203140 (57%)
[  9]   4.00-5.00   sec   123 MBytes  1.03 Gbits/sec  0.017 ms  115425/203123 (57%)
[ 11]   4.00-5.00   sec   122 MBytes  1.02 Gbits/sec  0.013 ms  116144/203140 (57%)
[SUM]   4.00-5.00   sec   490 MBytes  4.11 Gbits/sec  0.016 ms  463398/812532 (57%)
- - - - - - - - - - - - - - - - - - - - - - - - -
[  5]   5.00-6.00   sec   120 MBytes  1.01 Gbits/sec  0.022 ms  117455/203241 (58%)
[  6]   5.00-6.00   sec   123 MBytes  1.03 Gbits/sec  0.022 ms  115785/203257 (57%)
[  9]   5.00-6.00   sec   123 MBytes  1.03 Gbits/sec  0.023 ms  115539/203263 (57%)
[ 11]   5.00-6.00   sec   122 MBytes  1.02 Gbits/sec  0.023 ms  116512/203255 (57%)
[SUM]   5.00-6.00   sec   488 MBytes  4.09 Gbits/sec  0.023 ms  465291/813016 (57%)
- - - - - - - - - - - - - - - - - - - - - - - - -
[  5]   6.00-7.00   sec   116 MBytes   971 Mbits/sec  0.015 ms  120389/202814 (59%)
[  6]   6.00-7.00   sec   119 MBytes  1.00 Gbits/sec  0.010 ms  117896/202957 (58%)
[  9]   6.00-7.00   sec   121 MBytes  1.02 Gbits/sec  0.023 ms  116693/202940 (58%)
[ 11]   6.00-7.00   sec   118 MBytes   988 Mbits/sec  0.011 ms  119068/202957 (59%)
[SUM]   6.00-7.00   sec   474 MBytes  3.98 Gbits/sec  0.015 ms  474046/811668 (58%)
- - - - - - - - - - - - - - - - - - - - - - - - -
[  5]   7.00-8.00   sec   119 MBytes   998 Mbits/sec  0.009 ms  118459/203188 (58%)
[  6]   7.00-8.00   sec   121 MBytes  1.01 Gbits/sec  0.013 ms  117195/203087 (58%)
[  9]   7.00-8.00   sec   117 MBytes   981 Mbits/sec  0.011 ms  119700/203046 (59%)
[ 11]   7.00-8.00   sec   119 MBytes   996 Mbits/sec  0.012 ms  118481/203087 (58%)
[SUM]   7.00-8.00   sec   475 MBytes  3.99 Gbits/sec  0.011 ms  473835/812408 (58%)
- - - - - - - - - - - - - - - - - - - - - - - - -
[  5]   8.00-9.00   sec   122 MBytes  1.02 Gbits/sec  0.020 ms  116771/203418 (57%)
[  6]   8.00-9.00   sec   122 MBytes  1.02 Gbits/sec  0.014 ms  116689/203445 (57%)
[  9]   8.00-9.00   sec   122 MBytes  1.02 Gbits/sec  0.013 ms  116864/203438 (57%)
[ 11]   8.00-9.00   sec   120 MBytes  1.01 Gbits/sec  0.023 ms  117691/203420 (58%)
[SUM]   8.00-9.00   sec   485 MBytes  4.07 Gbits/sec  0.017 ms  468015/813721 (58%)
- - - - - - - - - - - - - - - - - - - - - - - - -
[  5]   9.00-10.00  sec   123 MBytes  1.03 Gbits/sec  0.016 ms  115712/203031 (57%)
[  6]   9.00-10.00  sec   123 MBytes  1.03 Gbits/sec  0.018 ms  115563/203054 (57%)
[  9]   9.00-10.00  sec   123 MBytes  1.03 Gbits/sec  0.011 ms  115746/203054 (57%)
[ 11]   9.00-10.00  sec   123 MBytes  1.03 Gbits/sec  0.018 ms  115703/203066 (57%)
[SUM]   9.00-10.00  sec   491 MBytes  4.12 Gbits/sec  0.016 ms  462724/812205 (57%)
- - - - - - - - - - - - - - - - - - - - - - - - -
[  5]  10.00-10.00  sec   206 KBytes  1.02 Gbits/sec  0.011 ms  0/143 (0%)
[  6]  10.00-10.00  sec   218 KBytes  1.08 Gbits/sec  0.018 ms  0/152 (0%)
[  9]  10.00-10.00  sec   211 KBytes  1.05 Gbits/sec  0.010 ms  0/147 (0%)
[ 11]  10.00-10.00  sec   208 KBytes  1.03 Gbits/sec  0.011 ms  0/145 (0%)
[SUM]  10.00-10.00  sec   844 KBytes  4.19 Gbits/sec  0.012 ms  0/587 (0%)
- - - - - - - - - - - - - - - - - - - - - - - - -
[ ID] Interval           Transfer     Bitrate         Jitter    Lost/Total Datagrams
[  5]   0.00-10.00  sec  1.18 GBytes  1.01 Gbits/sec  0.011 ms  1170176/2030971 (58%)  receiver
[  6]   0.00-10.00  sec  1.19 GBytes  1.02 Gbits/sec  0.018 ms  1163621/2031264 (57%)  receiver
[  9]   0.00-10.00  sec  1.17 GBytes  1.01 Gbits/sec  0.010 ms  1175570/2031116 (58%)  receiver
[ 11]   0.00-10.00  sec  1.15 GBytes   991 Mbits/sec  0.011 ms  1189040/2030907 (59%)  receiver
[SUM]   0.00-10.00  sec  4.70 GBytes  4.03 Gbits/sec  0.012 ms  4698407/8124258 (58%)  receiver


iperf Done.
so the client can blast 10g with UDP but the server only receives about 4G. There is a massive loss.
I looked more closely to my CPU thinking maybe it was not going Turbo and I was right.
pfSense is reporting Current: 2200 MHz, Max: 2201 MHz. However, I still suspect this is the reason 2.2GHz fixed CPU should be capable of 10g anyway.However, this CPU should be able to go up to 3.00 GHz in any case.
Checking in with sysctl
sysctl dev.cpu | grep freq
dev.cpu.7.freq_levels: 2201/60000 2200/60000 2100/56352 2000/52778 1900/49855 1800/46415 1700/43611 1600/40303 1500/37618 1400/34440 1300/31871 1200/28822 1100/26367 1000/23442
dev.cpu.7.freq: 2200
dev.cpu.6.freq_levels: 2201/60000 2200/60000 2100/56352 2000/52778 1900/49855 1800/46415 1700/43611 1600/40303 1500/37618 1400/34440 1300/31871 1200/28822 1100/26367 1000/23442
dev.cpu.6.freq: 2200
dev.cpu.5.freq_levels: 2201/60000 2200/60000 2100/56352 2000/52778 1900/49855 1800/46415 1700/43611 1600/40303 1500/37618 1400/34440 1300/31871 1200/28822 1100/26367 1000/23442
dev.cpu.5.freq: 2200
dev.cpu.4.freq_levels: 2201/60000 2200/60000 2100/56352 2000/52778 1900/49855 1800/46415 1700/43611 1600/40303 1500/37618 1400/34440 1300/31871 1200/28822 1100/26367 1000/23442
dev.cpu.4.freq: 2200
dev.cpu.3.freq_levels: 2201/60000 2200/60000 2100/56352 2000/52778 1900/49855 1800/46415 1700/43611 1600/40303 1500/37618 1400/34440 1300/31871 1200/28822 1100/26367 1000/23442
dev.cpu.3.freq: 2200
dev.cpu.2.freq_levels: 2201/60000 2200/60000 2100/56352 2000/52778 1900/49855 1800/46415 1700/43611 1600/40303 1500/37618 1400/34440 1300/31871 1200/28822 1100/26367 1000/23442
dev.cpu.2.freq: 2200
dev.cpu.1.freq_levels: 2201/60000 2200/60000 2100/56352 2000/52778 1900/49855 1800/46415 1700/43611 1600/40303 1500/37618 1400/34440 1300/31871 1200/28822 1100/26367 1000/23442
dev.cpu.1.freq: 2200
dev.cpu.0.freq_levels: 2201/60000 2200/60000 2100/56352 2000/52778 1900/49855 1800/46415 1700/43611 1600/40303 1500/37618 1400/34440 1300/31871 1200/28822 1100/26367 1000/23442
dev.cpu.0.freq: 2200
and after putting some heavy load on CPU to test it stayed stuck at 2200.
sysctl dev.cpu | grep freq was also reporting the same during the test.
Then I went into BIOS to play with power settings which is a foreign territory to me.
But the power technology was set to "Energy Efficient" which did not let me modify anything at all. I changed this to Custom
Then for tuning I choose OS controls EPB but pfsense was still reporting the CPU at 2200. (PowerD enabled with HiAdpt)
I am not sure what I did wrong here, I assumed pfSense can manage P states of CPU. But it did not work and I had to enable BIOS controls EPB with Maximum Performance
Anyway, after a lot of rebooting and tinkering I got to see 2693 on my CPU. (This was the highest I could get)
PowerD disabled, Speed Shift enabled at 10 with core level control.As a final test, I run iperf3 again. I saw marginal improvements up to 6g with p4 but that is it. Nowhere near where it should be.
My current BIOS settings are:
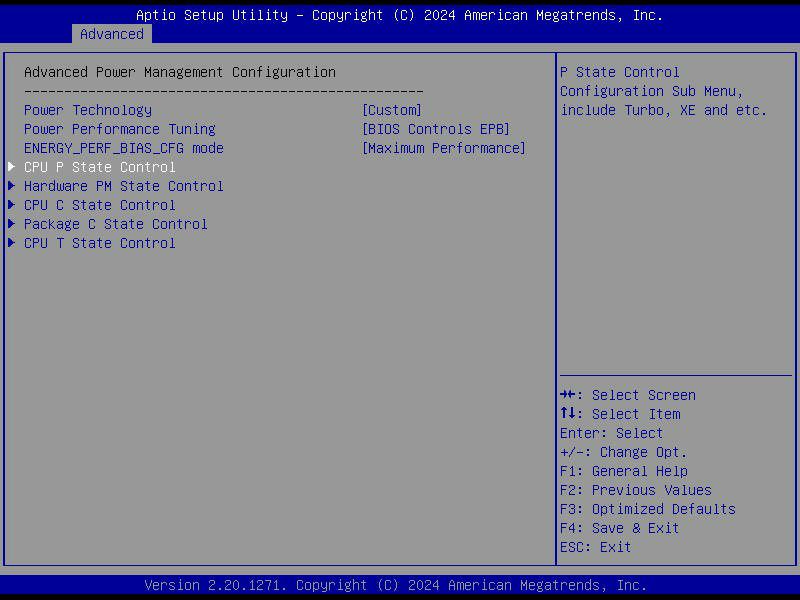
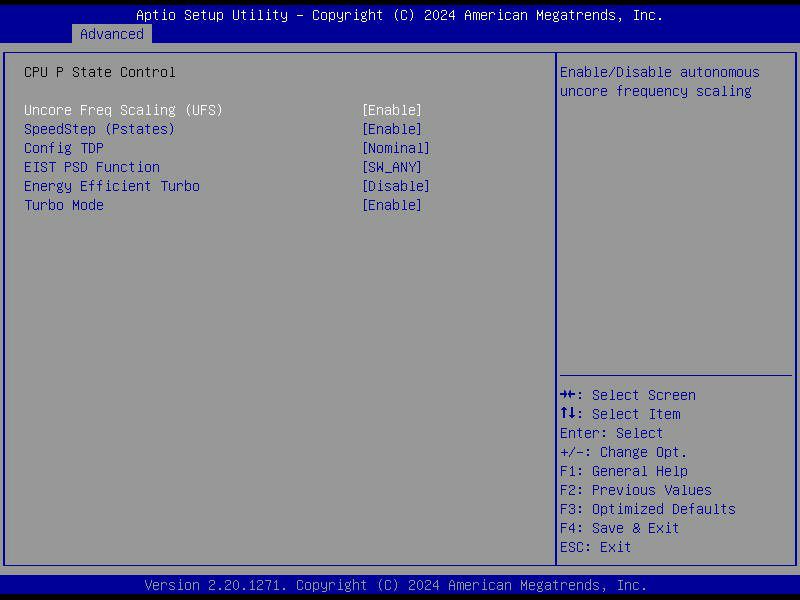
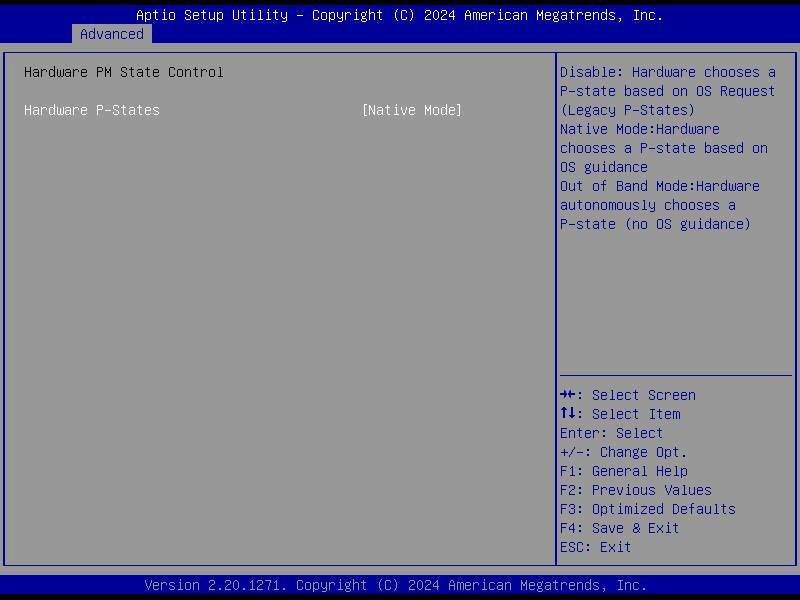
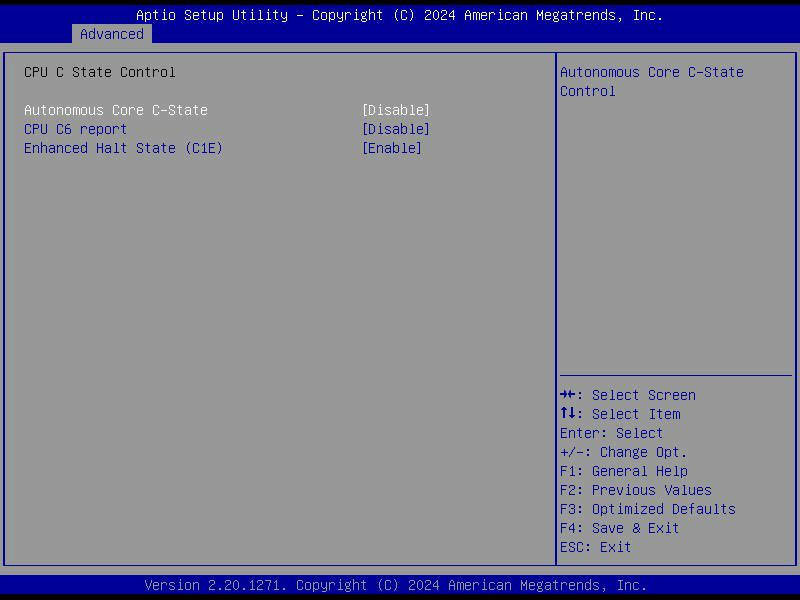
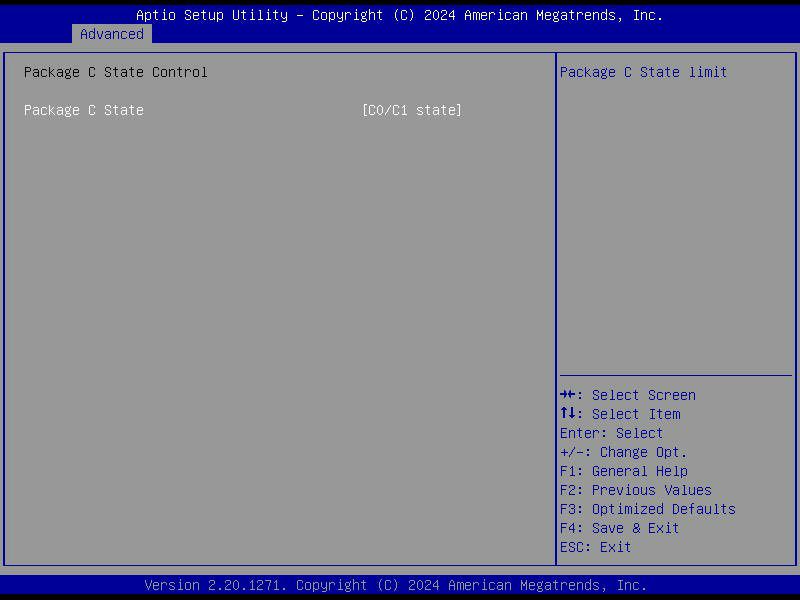
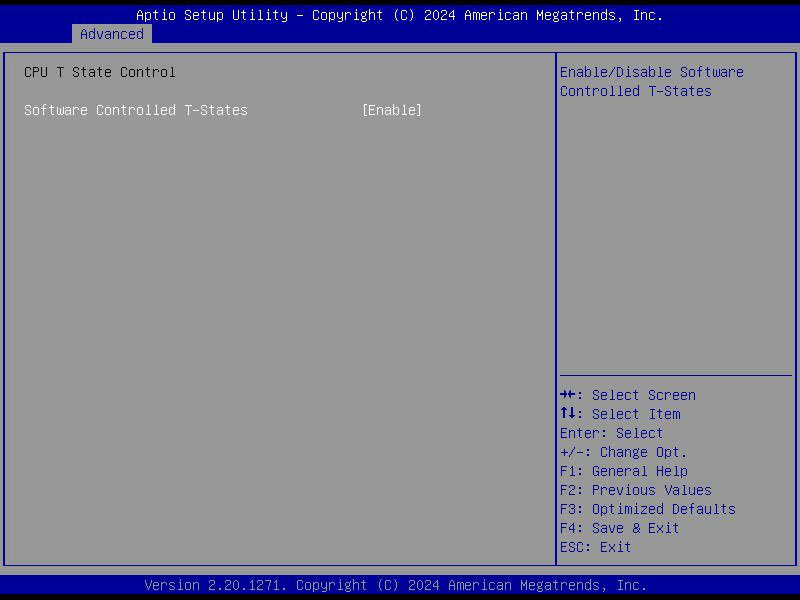
+@stephenw10 said in Cannot Achieve 10g pfsense bottleneck:
The max value shown there of 2201 means that Turbo is enabled. It never actually shows the turbo speed on a speed-step enabled CPU. But it could be hitting some thermal/power limit perhaps I agree. Though I'd expect to see some spikes above the 5Gbps if that was the case. At least some variation between repeated tests.
CPU is not thermal throttling, it is generally at 50C even with all the testing.
I am also not sure what are the suitable BIOS settings for the pfsense since I am having hard time. Is there anyone with the same CPU?
-
You will never see the reported CPU frequency show the 3.0GHz turbo value. pfSense can only ever see 2201 which means the full speed with turbo.
-
You should probably separate the problem into stages rather the just assume is a CPU issue.
Ideally you need to build a Lab setup rather than use a production system. That way you have control over any background activities.
Test with UDP between each server & PfSense iperf directly. Try running it with PfSense as the server, and then the other way round. That should prove you can get full speed to & from each server to PF in all modes & prove your Microtik VLAN's plus PF Firewall rules.
If the above works, then it must be the PF Routing engine where the packets are being dropped.
-
@pwood999 said in Cannot Achieve 10g pfsense bottleneck:
You should probably separate the problem into stages rather the just assume is a CPU issue.
Can you name the stages you have in mind to divide the problem into?
CPU performance is crucial on a platform where packet forwarding is performed in software. Testing with UDP is a non-sense, cause it has no flow control and you have to calculate the possible throughput by accounting the packet lost. Running pfSense as iPerf server coast also CPU time to process packets received and does not reflect the possible throughput of the platform. Testing between two endpoints connected to Pfsense is the right way to do. It's why it is called throughput ...
Devices in between may affect possible throughput, especially when packet lost occurs there for whatever reason and TCP congestion algorithms kicks in. So it's good to check the interface counter in the path and ensure there are no drops on interfaces in the path for whatever reason.My suggestion is to disable HT / SMT, scale queues down to 4 and there might be another improvement. The Intel SpeedShift may work better on packed level rather than core level.
-
@Averlon what would you suggest for other BIOS power settings? Can pfSense manage power well enough for me to disable BIOS control? From my testing, when I let pfSense manage the power, it did not go over the 2200 limit (or I put some wrong settings in the BIOS and got stuck at 2200 when I let pfsense handle the power management)
-
@Laxarus
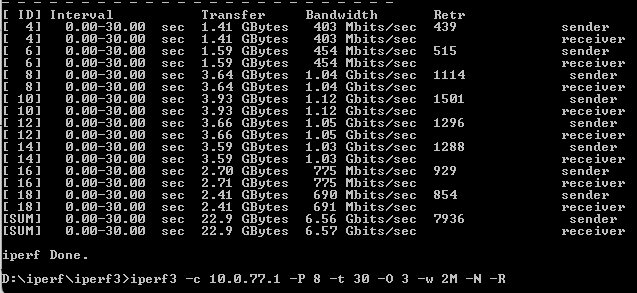
And never getting closer with your settings.This is what I am using on a Windows machine
iperf3 -c 192.168.40.40 -P 8 -t 30 -O 3 -w 2M -N -RAs @stephenw10 already said, this is not a CPU frequency issue, this is just maximum reported by pfSense.
@Laxarus said in Cannot Achieve 10g pfsense bottleneck:
I cannot afford testing this hardware in a virtual environment. This is currently in production and there is no backup for it.
Are you using UEFI mode and SATA drive or this is NVME installation?
-
@w0w ı was using legacy but switched to uefi later thinking this will improve things but it did not change anything. Installation is on a m.2 nvme.