Netgate Discussion Forum
    • Categories
    • Recent
    • Tags
    • Popular
    • Users
    • Search
    • Register
    • Login

    Latency spikes during Filter reload - CE 2.6.0

    General pfSense Questions
    6
    36
    4.1k
    Loading More Posts
    • Oldest to Newest
    • Newest to Oldest
    • Most Votes
    Reply
    • Reply as topic
    Log in to reply
    This topic has been deleted. Only users with topic management privileges can see it.
    • A
      Averlon
      last edited by

      Hi Community,

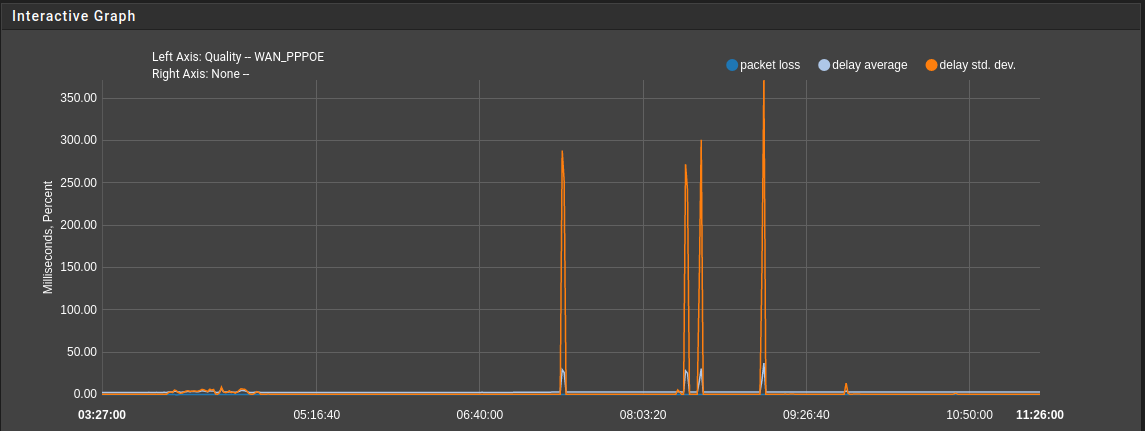
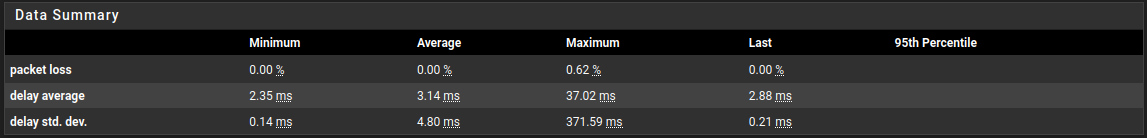
      after updating from 2.5.1 to 2.6.0 I notice a heavy spike in the dpinger stats if filter gets reloaded. Looking further into this, it turns out that Realtime Communication (Video Conference / VoIP Calls) also gets stucked for ~3 to 5 Seconds during the reload process. SSH Connection to the firewall goes unresponsive, too. Looking at the Interactive Graph, the spikes are noticeable for all monitored interfaces. Here an example of the WAN Interface stats.

      15932302-51b7-4557-b090-070bef056fcb-image.png
      691bc86d-79f8-434e-bc19-7f8f98512d62-image.png

      The Hardware pfSense is running on, is a Xeon-D 1541 SoC with 32GB ECC Memory. It's booting from a NVME. All 6 NICs are 1000Base-T (Intel I350 - igb driver 7.6.1-k). TSO and LRO are disabled.
      4 of the 6 NICs are currently in use. In total the System has 15 IP Interfaces configured:

      • PPPOE WAN (bound to Vlan on dedicated NIC)
      • LAN (deticated NIC)
      • 4 VLAN
      • 9 IPsec VTIs

      Packages in Use are

      • Snort (IDS with Legacy Blocking Mode)
      • pfBlockerNG-Devel
      • FRR
      • Backup
      • Cron
      • openvpn-client-export
      • Service_Watchdog
      • System_Patches (No Patch has Auto Apply enabled)

      About the Firewall Configuration:
      According to pfctl -sr | wc -l there are currently 1817 Firewall Rules running on the Box. The Table count is around ~290000 entries. pfInfo is not looking suspicious to me:

      Status: Enabled for 0 days 18:05:37           Debug: Urgent
      Hostid:   0x6f27faed
      Checksum: 0xb1cc6725c8bf4e1f11275f5e1f93e1c2
      
      Interface Stats for igb0              IPv4             IPv6
        Bytes In                    463614058159                0
        Bytes Out                    48685910071                0
        Packets In
          Passed                       335871378                0
          Blocked                            908                0
        Packets Out
          Passed                               0                0
          Blocked                              0                0
      
      State Table                          Total             Rate
        current entries                     1557               
        searches                      1923206065        29525.6/s
        inserts                          2233624           34.3/s
        removals                         2232068           34.3/s
      Source Tracking Table
        current entries                        0               
        searches                               0            0.0/s
        inserts                                0            0.0/s
        removals                               0            0.0/s
      Counters
        match                            2270057           34.9/s
        bad-offset                             0            0.0/s
        fragment                               0            0.0/s
        short                                  0            0.0/s
        normalize                              4            0.0/s
        memory                                 0            0.0/s
        bad-timestamp                          0            0.0/s
        congestion                             0            0.0/s
        ip-option                              0            0.0/s
        proto-cksum                            0            0.0/s
        state-mismatch                        41            0.0/s
        state-insert                           1            0.0/s
        state-limit                            0            0.0/s
        src-limit                              0            0.0/s
        synproxy                               0            0.0/s
        map-failed                             0            0.0/s
      Limit Counters
        max states per rule                    0            0.0/s
        max-src-states                         0            0.0/s
        max-src-nodes                          0            0.0/s
        max-src-conn                           0            0.0/s
        max-src-conn-rate                      0            0.0/s
        overload table insertion               0            0.0/s
        overload flush states                  0            0.0/s
        synfloods detected                     0            0.0/s
        syncookies sent                        0            0.0/s
        syncookies validated                   0            0.0/s
      Syncookies
        mode                      never
      
      states        hard limit  3260000
      src-nodes     hard limit  3260000
      frags         hard limit     5000
      table-entries hard limit  2500000
      
      tcp.first                   120s
      tcp.opening                  30s
      tcp.established           86400s
      tcp.closing                 900s
      tcp.finwait                  45s
      tcp.closed                   90s
      tcp.tsdiff                   30s
      udp.first                    60s
      udp.single                   30s
      udp.multiple                180s
      icmp.first                   20s
      icmp.error                   10s
      other.first                  60s
      other.single                 30s
      other.multiple               60s
      frag                         30s
      interval                     10s
      adaptive.start          1956000 states
      adaptive.end            3912000 states
      src.track                     0s
      

      The Firewall config was running fine on 2.5.1 without any issues reloading the ruleset, even during prime time. I found this Issue on Redmine, which describes a very similar behavior for 2.4.5. I guess, it's not the same root cause here. I have another pfSense on 2.6.0, running as VM with lower HW spec, which has about 400k Table entries but only 400 rules. There we cannot reproduce this latency spikes.
      Does anyone experience similar effects on 2.6.0?

      S 1 Reply Last reply Reply Quote 0
      • A
        Averlon
        last edited by

        I did some more digging by testing 2.6.0 on another Hardware (Intel Atom C3558 SoC / 32GB Memory). Made a fresh Install from 2.6.0 ISO on the box and ported the config of the affected System into it. The System was never online and had no additional packages installed. The table entries were quite low, since there was no update made by pfb. A simple reload of the ~1800 Lines ruleset had the same effect, like on the live system. SSH Session starts to hang and icmp rtt of ping requests to the lan if spike for a couple of seconds.

        ~ 1800 Rules
        
        42 packets transmitted, 42 received, 0% packet loss, time 41933ms
        rtt min/avg/max/mdev = 0.194/208.560/3722.655/732.564 ms
        

        Since I'm running multiple installations of pfSense, with more of less similar configs and only one is affected, I was wondering were this may come from. The only difference was the hardware and the higher rule count on the affected System. I started to delete rules and measured the impact during filter reload by icmp request to the lan interface.

        ~ 1500 Rules
        24 packets transmitted, 24 received, 0% packet loss, time 23526ms
        rtt min/avg/max/mdev = 0.184/234.199/2895.143/685.703 ms
        
        ~ 1200 Rules
        23 packets transmitted, 23 received, 0% packet loss, time 22487ms
        rtt min/avg/max/mdev = 0.204/144.235/2127.471/478.763 ms
        
        ~ 800 Rules
        14 packets transmitted, 14 received, 0% packet loss, time 13272ms
        rtt min/avg/max/mdev = 0.204/244.920/2165.553/607.515 ms
        
        ~ 700 Rules 
        28 packets transmitted, 28 received, 0% packet loss, time 27537ms
        rtt min/avg/max/mdev = 0.197/35.594/986.879/183.074 ms
        
        ~ 600 Rules
        23 packets transmitted, 23 received, 0% packet loss, time 22480ms
        rtt min/avg/max/mdev = 0.206/0.903/14.520/2.904 ms
        
        < 400 Rules
        20 packets transmitted, 20 received, 0% packet loss, time 19433ms
        rtt min/avg/max/mdev = 0.202/0.359/0.497/0.122 ms
        
        1 Reply Last reply Reply Quote 0
        • stephenw10S
          stephenw10 Netgate Administrator
          last edited by

          Hmm, well it doesn't appear to be a regression of that bug specifically:

          [22.01-RELEASE][admin@5100.stevew.lan]/root: pfctl -t bogonsv6 -T flush
          128188 addresses deleted.
          [22.01-RELEASE][admin@5100.stevew.lan]/root: time pfctl -t bogonsv6 -T add -f /etc/bogonsv6
          128188/128188 addresses added.
          0.406u 0.234s 0:00.64 98.4%	205+185k 1+0io 0pf+0w
          

          At least not on that hardware.

          Steve

          A 1 Reply Last reply Reply Quote 0
          • A
            Averlon @stephenw10
            last edited by

            The impact on the Firewall is similar to Redmine 10414, not that heavy as described there but bad enough to silence collaboration for 3 to 5 seconds. The cause for this is somewhere else, table sizes seems to be irrelevant. It can be triggered by pfctl -f /tmp/rules.debug at a certain line count of rules. It starts lightly somewhere between 400 and 600 lines and getting worst if more rules are present.

            Cool_CoronaC 1 Reply Last reply Reply Quote 0
            • Cool_CoronaC
              Cool_Corona @Averlon
              last edited by

              @averlon Same as the bug in 2.5.0 as I recall??

              1 Reply Last reply Reply Quote 0
              • stephenw10S
                stephenw10 Netgate Administrator
                last edited by

                We are setting up testing to try to replicate locally.

                1 Reply Last reply Reply Quote 0
                • C
                  cclarke69
                  last edited by

                  I see the same symptom.

                  I7-5500u
                  8gb RAM
                  6x Intel NICS
                  120gb SSD

                  Home network for the family, so failing the WAF currently.

                  1 Reply Last reply Reply Quote 0
                  • stephenw10S
                    stephenw10 Netgate Administrator
                    last edited by

                    What sort of latency are you seeing? How many firewall lines?

                    C 1 Reply Last reply Reply Quote 0
                    • C
                      cclarke69 @stephenw10
                      last edited by

                      @stephenw10 - around 300 active rules across 10 interfaces. WAN RTT goes from <7ms to >200 ms for around 50s. RTTd from 0.2ms to > 800ms for the same period.

                      1 Reply Last reply Reply Quote 0
                      • stephenw10S
                        stephenw10 Netgate Administrator
                        last edited by

                        Urgh, that's pretty bad.

                        How many actual rulset lines though? As reported by: pfctl -sr | wc -l

                        If you run the table reload commands I showed above do those come back in reasonable time?

                        Steve

                        C 3 Replies Last reply Reply Quote 0
                        • C
                          cclarke69 @stephenw10
                          last edited by

                          @stephenw10 - output of pfctl -sr | wc -l is 1987. That command returns in about 1s

                          1 Reply Last reply Reply Quote 0
                          • C
                            cclarke69 @stephenw10
                            last edited by

                            @stephenw10 - Which table reload command do you mean?

                            1 Reply Last reply Reply Quote 0
                            • C
                              cclarke69 @stephenw10
                              last edited by

                              @stephenw10 - 1 table created.
                              128188/128188 addresses added.
                              0.29 real 0.12 user 0.16 sys

                              for time pfctl -t bogonsv6 -T add -f /etc/bogonsv6

                              1 Reply Last reply Reply Quote 0
                              • stephenw10S
                                stephenw10 Netgate Administrator
                                last edited by

                                Yes, that. And those times look fine.

                                You might also try:

                                [22.01-RELEASE][admin@5100.stevew.lan]/root: time pfctl -f /tmp/rules.debug
                                0.377u 0.329s 0:00.70 98.5%	208+187k 1+0io 0pf+0w
                                

                                Hardly additional rules on that box though:

                                [22.01-RELEASE][admin@5100.stevew.lan]/root: pfctl -sr | wc -l
                                     121
                                

                                Steve

                                C 4 Replies Last reply Reply Quote 0
                                • C
                                  cclarke69 @stephenw10
                                  last edited by

                                  @stephenw10 - time pfctl -f /tmp/rules.debug -> 6.06 real 0.35 user 5.70 sys

                                  1 Reply Last reply Reply Quote 0
                                  • C
                                    cclarke69 @stephenw10
                                    last edited by

                                    @stephenw10 - 0.370u 5.780s 0:06.15 100.0% 203+182k 5+0io 0pf+0w

                                    1 Reply Last reply Reply Quote 0
                                    • C
                                      cclarke69 @stephenw10
                                      last edited by

                                      @stephenw10 - If it helps, I've restarted the pfSense and observed the stats. The WAN RTT was very high for ~50s after the GUI became available. The OpenVPN interfaces carried over the WAN connection gave normal RTT immediately.

                                      1 Reply Last reply Reply Quote 0
                                      • C
                                        cclarke69 @stephenw10
                                        last edited by

                                        @stephenw10 - And wireguard doesn't start after reboot. Having resaved the wireguard peers, the Gateways looked like

                                        d04c5886-afff-434b-b5a8-e83fb0d52e76-image.png

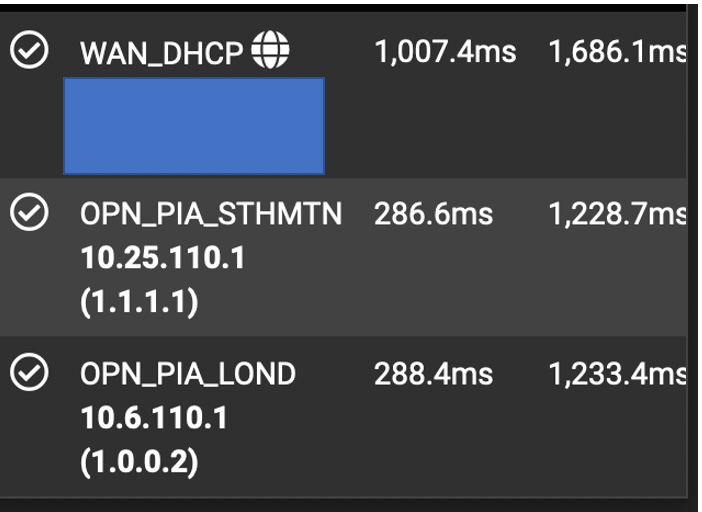
                                        When all should be sub 10ms.

                                        1 Reply Last reply Reply Quote 0
                                        • stephenw10S
                                          stephenw10 Netgate Administrator
                                          last edited by

                                          Hmm, those Wireguard stats are continually? Or for the 50s after boot?

                                          6s to load the ruleset is pretty extreme too.

                                          Testing here with a 1700 line ruleset and not seeing this. Still digging....

                                          C A 4 Replies Last reply Reply Quote 0
                                          • C
                                            cclarke69 @stephenw10
                                            last edited by

                                            @stephenw10 - The stats above are for WAN and 2 OpenVPN interfaces, during the ~50s after Wireguard starts. I assume the rules are reloaded at that time? The other point I was making is that Wireguard won't start after reboot, until the WG peers have been disabled and re-enabled. I believe there's another thread somewhere on that topic. Wireguard was fine on 2.5.2

                                            1 Reply Last reply Reply Quote 0
                                            • First post
                                              Last post
                                            Copyright 2025 Rubicon Communications LLC (Netgate). All rights reserved.