Netgate Discussion Forum
    • Categories
    • Recent
    • Tags
    • Popular
    • Users
    • Search
    • Register
    • Login

    Latency spikes during Filter reload - CE 2.6.0

    Scheduled Pinned Locked Moved General pfSense Questions
    36 Posts 6 Posters 5.5k Views
    Loading More Posts
    • Oldest to Newest
    • Newest to Oldest
    • Most Votes
    Reply
    • Reply as topic
    Log in to reply
    This topic has been deleted. Only users with topic management privileges can see it.
    • A
      Averlon
      last edited by

      I did some more digging by testing 2.6.0 on another Hardware (Intel Atom C3558 SoC / 32GB Memory). Made a fresh Install from 2.6.0 ISO on the box and ported the config of the affected System into it. The System was never online and had no additional packages installed. The table entries were quite low, since there was no update made by pfb. A simple reload of the ~1800 Lines ruleset had the same effect, like on the live system. SSH Session starts to hang and icmp rtt of ping requests to the lan if spike for a couple of seconds.

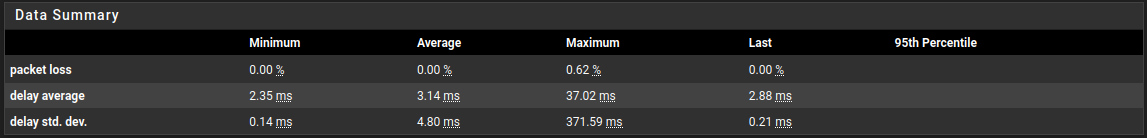
      ~ 1800 Rules
      
      42 packets transmitted, 42 received, 0% packet loss, time 41933ms
      rtt min/avg/max/mdev = 0.194/208.560/3722.655/732.564 ms
      

      Since I'm running multiple installations of pfSense, with more of less similar configs and only one is affected, I was wondering were this may come from. The only difference was the hardware and the higher rule count on the affected System. I started to delete rules and measured the impact during filter reload by icmp request to the lan interface.

      ~ 1500 Rules
      24 packets transmitted, 24 received, 0% packet loss, time 23526ms
      rtt min/avg/max/mdev = 0.184/234.199/2895.143/685.703 ms
      
      ~ 1200 Rules
      23 packets transmitted, 23 received, 0% packet loss, time 22487ms
      rtt min/avg/max/mdev = 0.204/144.235/2127.471/478.763 ms
      
      ~ 800 Rules
      14 packets transmitted, 14 received, 0% packet loss, time 13272ms
      rtt min/avg/max/mdev = 0.204/244.920/2165.553/607.515 ms
      
      ~ 700 Rules 
      28 packets transmitted, 28 received, 0% packet loss, time 27537ms
      rtt min/avg/max/mdev = 0.197/35.594/986.879/183.074 ms
      
      ~ 600 Rules
      23 packets transmitted, 23 received, 0% packet loss, time 22480ms
      rtt min/avg/max/mdev = 0.206/0.903/14.520/2.904 ms
      
      < 400 Rules
      20 packets transmitted, 20 received, 0% packet loss, time 19433ms
      rtt min/avg/max/mdev = 0.202/0.359/0.497/0.122 ms
      
      1 Reply Last reply Reply Quote 0
      • stephenw10S
        stephenw10 Netgate Administrator
        last edited by

        Hmm, well it doesn't appear to be a regression of that bug specifically:

        [22.01-RELEASE][admin@5100.stevew.lan]/root: pfctl -t bogonsv6 -T flush
        128188 addresses deleted.
        [22.01-RELEASE][admin@5100.stevew.lan]/root: time pfctl -t bogonsv6 -T add -f /etc/bogonsv6
        128188/128188 addresses added.
        0.406u 0.234s 0:00.64 98.4%	205+185k 1+0io 0pf+0w
        

        At least not on that hardware.

        Steve

        A 1 Reply Last reply Reply Quote 0
        • A
          Averlon @stephenw10
          last edited by

          The impact on the Firewall is similar to Redmine 10414, not that heavy as described there but bad enough to silence collaboration for 3 to 5 seconds. The cause for this is somewhere else, table sizes seems to be irrelevant. It can be triggered by pfctl -f /tmp/rules.debug at a certain line count of rules. It starts lightly somewhere between 400 and 600 lines and getting worst if more rules are present.

          Cool_CoronaC 1 Reply Last reply Reply Quote 0
          • Cool_CoronaC
            Cool_Corona @Averlon
            last edited by

            @averlon Same as the bug in 2.5.0 as I recall??

            1 Reply Last reply Reply Quote 0
            • stephenw10S
              stephenw10 Netgate Administrator
              last edited by

              We are setting up testing to try to replicate locally.

              1 Reply Last reply Reply Quote 0
              • C
                cclarke69
                last edited by

                I see the same symptom.

                I7-5500u
                8gb RAM
                6x Intel NICS
                120gb SSD

                Home network for the family, so failing the WAF currently.

                1 Reply Last reply Reply Quote 0
                • stephenw10S
                  stephenw10 Netgate Administrator
                  last edited by

                  What sort of latency are you seeing? How many firewall lines?

                  C 1 Reply Last reply Reply Quote 0
                  • C
                    cclarke69 @stephenw10
                    last edited by

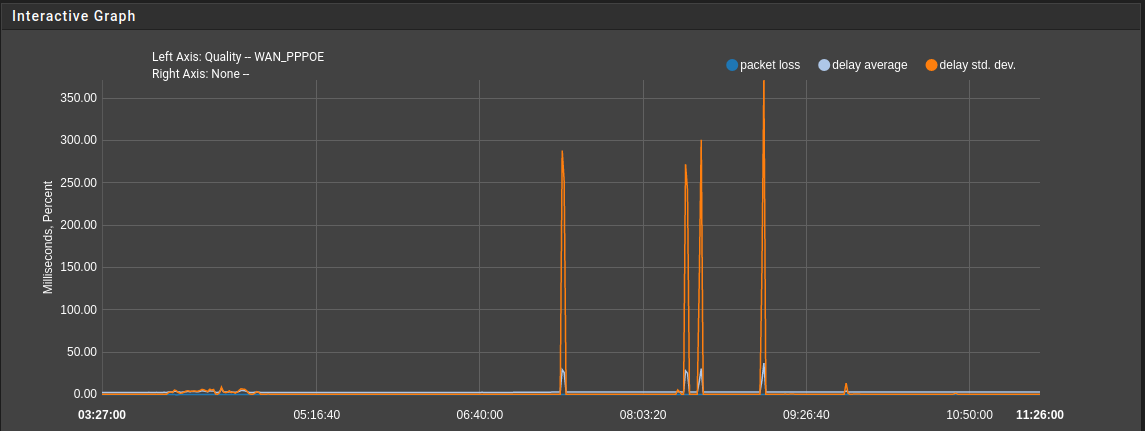
                    @stephenw10 - around 300 active rules across 10 interfaces. WAN RTT goes from <7ms to >200 ms for around 50s. RTTd from 0.2ms to > 800ms for the same period.

                    1 Reply Last reply Reply Quote 0
                    • stephenw10S
                      stephenw10 Netgate Administrator
                      last edited by

                      Urgh, that's pretty bad.

                      How many actual rulset lines though? As reported by: pfctl -sr | wc -l

                      If you run the table reload commands I showed above do those come back in reasonable time?

                      Steve

                      C 3 Replies Last reply Reply Quote 0
                      • C
                        cclarke69 @stephenw10
                        last edited by

                        @stephenw10 - output of pfctl -sr | wc -l is 1987. That command returns in about 1s

                        1 Reply Last reply Reply Quote 0
                        • C
                          cclarke69 @stephenw10
                          last edited by

                          @stephenw10 - Which table reload command do you mean?

                          1 Reply Last reply Reply Quote 0
                          • C
                            cclarke69 @stephenw10
                            last edited by

                            @stephenw10 - 1 table created.
                            128188/128188 addresses added.
                            0.29 real 0.12 user 0.16 sys

                            for time pfctl -t bogonsv6 -T add -f /etc/bogonsv6

                            1 Reply Last reply Reply Quote 0
                            • stephenw10S
                              stephenw10 Netgate Administrator
                              last edited by

                              Yes, that. And those times look fine.

                              You might also try:

                              [22.01-RELEASE][admin@5100.stevew.lan]/root: time pfctl -f /tmp/rules.debug
                              0.377u 0.329s 0:00.70 98.5%	208+187k 1+0io 0pf+0w
                              

                              Hardly additional rules on that box though:

                              [22.01-RELEASE][admin@5100.stevew.lan]/root: pfctl -sr | wc -l
                                   121
                              

                              Steve

                              C 4 Replies Last reply Reply Quote 0
                              • C
                                cclarke69 @stephenw10
                                last edited by

                                @stephenw10 - time pfctl -f /tmp/rules.debug -> 6.06 real 0.35 user 5.70 sys

                                1 Reply Last reply Reply Quote 0
                                • C
                                  cclarke69 @stephenw10
                                  last edited by

                                  @stephenw10 - 0.370u 5.780s 0:06.15 100.0% 203+182k 5+0io 0pf+0w

                                  1 Reply Last reply Reply Quote 0
                                  • C
                                    cclarke69 @stephenw10
                                    last edited by

                                    @stephenw10 - If it helps, I've restarted the pfSense and observed the stats. The WAN RTT was very high for ~50s after the GUI became available. The OpenVPN interfaces carried over the WAN connection gave normal RTT immediately.

                                    1 Reply Last reply Reply Quote 0
                                    • C
                                      cclarke69 @stephenw10
                                      last edited by

                                      @stephenw10 - And wireguard doesn't start after reboot. Having resaved the wireguard peers, the Gateways looked like

                                      d04c5886-afff-434b-b5a8-e83fb0d52e76-image.png

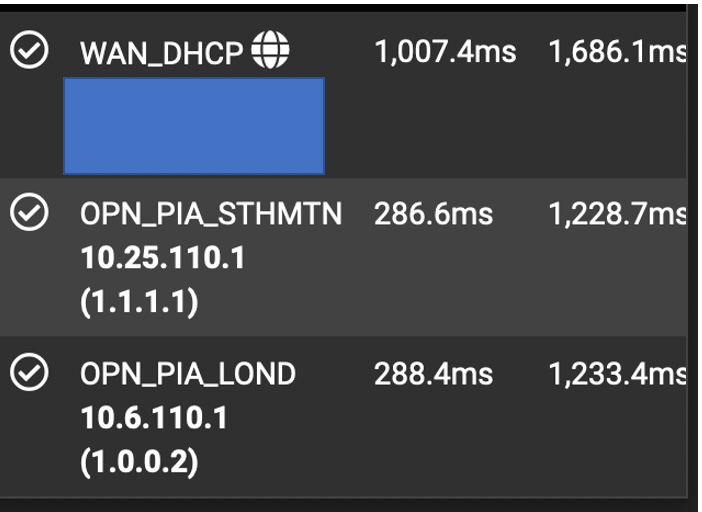
                                      When all should be sub 10ms.

                                      1 Reply Last reply Reply Quote 0
                                      • stephenw10S
                                        stephenw10 Netgate Administrator
                                        last edited by

                                        Hmm, those Wireguard stats are continually? Or for the 50s after boot?

                                        6s to load the ruleset is pretty extreme too.

                                        Testing here with a 1700 line ruleset and not seeing this. Still digging....

                                        C A 4 Replies Last reply Reply Quote 0
                                        • C
                                          cclarke69 @stephenw10
                                          last edited by

                                          @stephenw10 - The stats above are for WAN and 2 OpenVPN interfaces, during the ~50s after Wireguard starts. I assume the rules are reloaded at that time? The other point I was making is that Wireguard won't start after reboot, until the WG peers have been disabled and re-enabled. I believe there's another thread somewhere on that topic. Wireguard was fine on 2.5.2

                                          1 Reply Last reply Reply Quote 0
                                          • C
                                            cclarke69 @stephenw10
                                            last edited by

                                            @stephenw10 - Here is the ThinkBroadband Monitor showing pre and post upgrade

                                            c992bc11-674d-4561-b55c-aa807ac60967-image.png

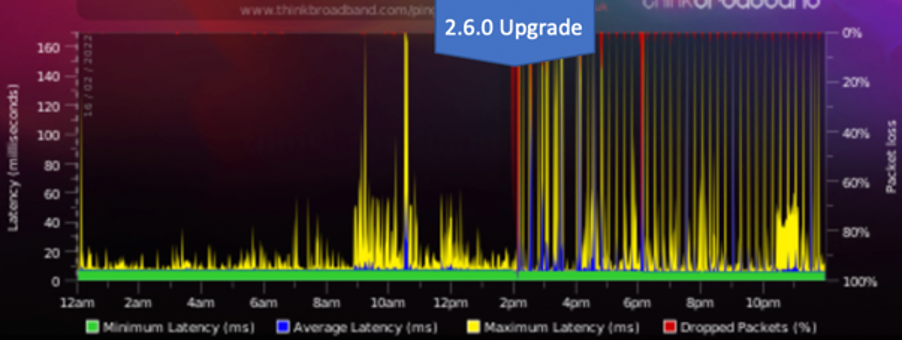
                                            Stopping the rc.filter_configure_sync cron job running stops the latency spikes.

                                            1 Reply Last reply Reply Quote 0
                                            • First post
                                              Last post
                                            Copyright 2025 Rubicon Communications LLC (Netgate). All rights reserved.