21.02 Sudden lockup
-
Understood. Tough to find a phantom bug! Some of the reports above say that there wasn't any output when it locked up. What is a signal 11 and what creates it? Is the core dump from a signal 11 of any use? (I have no idea how to retrieve it, but I thought I'd ask.)
-
@kphillips Yes, this is the first reboot after installing pfblockerng-devel.
Installed the program, ran the wizard, and reboot, and the problem happens.
To fix, got into the console, pressed 11 to restart the GUI, connected to it and disabled pfblockerng.
Then reboot and it's all fine. -
@mcury OK thank you. So to confirm, the webConfigurator is inaccessible and you cannot pass traffic at all when this happens? What if you ping by IP address rather than by hostname from a device attached to the LAN? If you ping 8.8.8.8, for example, does it succeed but DNS queries fail? Since pfBlockerNG ties into unbound (DNS Resolver) I'm wondering if its crashing the DNS Resolver causing your issue.
-
If you're still able to connect to the command line at the console but nothing else try to connect out. Can you ping anything local on any interface?
What does
ifconfig -vashow?What about
netstat -rndo you still have valid routes?Or
etherswitchcfgis the switch still responding?Steve
-
@stephenw10 Important to note: Do this from the USB serial from the option 8 shell and after the device has locked up BEFORE rebooting it, please.
-
@kphillips said in 21.02 Sudden lockup:
@mcury OK thank you. So to confirm, the webConfigurator is inaccessible and you cannot pass traffic at all when this happens? What if you ping by IP address rather than by hostname from a device attached to the LAN? If you ping 8.8.8.8, for example, does it succeed but DNS queries fail? Since pfBlockerNG ties into unbound (DNS Resolver) I'm wondering if its crashing the DNS Resolver causing your issue.
Yes, webConfigurator is inaccessible and I cannot pass traffic.
Ping to 8.8.8.8 fails, or any other IP on the internet (it's not DNS).I'll perform the tests through the console.
I'll reproduce the problem, give me a few minutes.
1 - enable pfblockerng-devel again
2 - Reboot
3 - Test again the ping to 8.8.8.8, ping the pfsense LAN interface.Then, I'll perform the tests @stephenw10 asked
1 - perform ifconfig -va
2 - netstat -rn
3 - etherswitchcfg to check the switch -
@rloeb no output for me when it locked up.
Once it reboots I can see the normal boot process.@kphillips Anything I can capture to help out?
-
After enabling pfBlockerNG, rebooted the system and the problem didn't happen.
So I accessed the GUI, clicked in Firewall>pfBlockerNG>Update>Reload all>RunThen I rebooted again, and the problem happened.
It seems that it happens hourly after the cron update from pfblockerng, or if I manually force a reload or an update, and it's triggered during the first boot after that.- GUI is inaccessible.
- SSH from a device in LAN to pfsense LAN interface - Works
- SSH from VLAN WIFI to devices in another VLAN - Don't work.
- Ping to pfsense LAN interface from a PC in the LAN - Works.
- Ping from a PC in the LAN to 8.8.8.8 - Don't work.
ifconfig -va
21.02-RELEASE][root@pfsense.local.lan]/root: ifconfig -va
mvneta0: flags=8a02<BROADCAST,ALLMULTI,SIMPLEX,MULTICAST> metric 0 mtu 1500
	options=800bb<RXCSUM,TXCSUM,VLAN_MTU,VLAN_HWTAGGING,JUMBO_MTU,VLAN_HWCSUM,LINKSTATE>
	ether 00:08:a2:0c:c4:1b
	media: Ethernet autoselect (none)
	status: no carrier
	nd6 options=21<PERFORMNUD,AUTO_LINKLOCAL>
mvneta1: flags=88a43<UP,BROADCAST,RUNNING,ALLMULTI,SIMPLEX,MULTICAST,STATICARP> metric 0 mtu 1500
	description: mgmt
	options=bb<RXCSUM,TXCSUM,VLAN_MTU,VLAN_HWTAGGING,JUMBO_MTU,VLAN_HWCSUM>
	ether 00:08:a2:0c:c4:1c
	inet6 fe80::208:a2ff:fe0c:c41c%mvneta1 prefixlen 64 scopeid 0x2
	inet 172.16.200.1 netmask 0xfffffff8 broadcast 172.16.200.7
	media: Ethernet 2500Base-KX <full-duplex>
	status: active
	nd6 options=21<PERFORMNUD,AUTO_LINKLOCAL>
mvneta2: flags=8a43<UP,BROADCAST,RUNNING,ALLMULTI,SIMPLEX,MULTICAST> metric 0 mtu 1500
	options=800bb<RXCSUM,TXCSUM,VLAN_MTU,VLAN_HWTAGGING,JUMBO_MTU,VLAN_HWCSUM,LINKSTATE>
	ether 00:08:a2:0c:c4:1d
	inet6 fe80::208:a2ff:fe0c:c41d%mvneta2 prefixlen 64 scopeid 0x8
	inet6 X:X:X:X:X:X:X:X prefixlen 64 autoconf
	inet6 X:X:X::X prefixlen 128
	inet X.X.X.X netmask 0xfffffc00 broadcast X.X.X.X
	inet 192.168.100.2 netmask 0xffffffff broadcast 192.168.100.2
	media: Ethernet autoselect (1000baseT <full-duplex>)
	status: active
	nd6 options=23<PERFORMNUD,ACCEPT_RTADV,AUTO_LINKLOCAL>
enc0: flags=0<> metric 0 mtu 1536
	groups: enc
	nd6 options=21<PERFORMNUD,AUTO_LINKLOCAL>
lo0: flags=8049<UP,LOOPBACK,RUNNING,MULTICAST> metric 0 mtu 16384
	options=680003<RXCSUM,TXCSUM,LINKSTATE,RXCSUM_IPV6,TXCSUM_IPV6>
	inet6 ::1 prefixlen 128
	inet6 fe80::1%lo0 prefixlen 64 scopeid 0xa
	inet 127.0.0.1 netmask 0xff000000
	inet 10.10.10.1 netmask 0xffffffff
	groups: lo
	nd6 options=21<PERFORMNUD,AUTO_LINKLOCAL>
pflog0: flags=100<PROMISC> metric 0 mtu 33184
	groups: pflog
pfsync0: flags=0<> metric 0 mtu 1500
	groups: pfsync
mvneta1.100: flags=88843<UP,BROADCAST,RUNNING,SIMPLEX,MULTICAST,STATICARP> metric 0 mtu 1500
	description: lan
	options=3<RXCSUM,TXCSUM>
	ether 00:08:a2:0c:c4:1c
	inet6 fe80::208:a2ff:fe0c:c41c%mvneta1.100 prefixlen 64 scopeid 0xd
	inet 192.168.255.249 netmask 0xfffffff8 broadcast 192.168.255.255
	groups: vlan
	vlan: 100 vlanpcp: 0 parent interface: mvneta1
	media: Ethernet Other <full-duplex>
	status: active
	nd6 options=21<PERFORMNUD,AUTO_LINKLOCAL>
mvneta1.10: flags=88843<UP,BROADCAST,RUNNING,SIMPLEX,MULTICAST,STATICARP> metric 0 mtu 1500
	description: wifi
	options=3<RXCSUM,TXCSUM>
	ether 00:08:a2:0c:c4:1c
	inet6 fe80::208:a2ff:fe0c:c41c%mvneta1.10 prefixlen 64 scopeid 0xe
	inet6 fe80::1:1%mvneta1.10 prefixlen 64 scopeid 0xe
	inet6 X:X:X:X:X:X:X:X prefixlen 64
	inet 192.168.10.1 netmask 0xfffffff0 broadcast 192.168.10.15
	groups: vlan
	vlan: 10 vlanpcp: 0 parent interface: mvneta1
	media: Ethernet Other <full-duplex>
	status: active
	nd6 options=21<PERFORMNUD,AUTO_LINKLOCAL>
mvneta1.20: flags=8843<UP,BROADCAST,RUNNING,SIMPLEX,MULTICAST> metric 0 mtu 1500
	description: guest
	options=3<RXCSUM,TXCSUM>
	ether 00:08:a2:0c:c4:1c
	inet6 fe80::208:a2ff:fe0c:c41c%mvneta1.20 prefixlen 64 scopeid 0xf
	inet 192.168.20.1 netmask 0xffffff00 broadcast 192.168.20.255
	groups: vlan
	vlan: 20 vlanpcp: 0 parent interface: mvneta1
	media: Ethernet Other <full-duplex>
	status: active
	nd6 options=21<PERFORMNUD,AUTO_LINKLOCAL>
netstat -rn
[21.02-RELEASE][root@pfsense.local.lan]/root: netstat -rn
Routing tables

Internet:
Destination        Gateway            Flags     Netif Expire
default            X.X.X.X      UGS     mvneta2
10.10.10.1         link#10            UH          lo0
127.0.0.1          link#10            UH          lo0
172.16.200.0/29    link#2             U       mvneta1
172.16.200.1       link#2             UHS         lo0
X.X.X.X/22   link#8             U       mvneta2
X.X.X.X    link#8             UHS         lo0
192.168.10.0/28    link#14            U      mvneta1.
192.168.10.1       link#14            UHS         lo0
192.168.20.0/24    link#15            U      mvneta1.
192.168.20.1       link#15            UHS         lo0
192.168.100.2      link#8             UHS         lo0
192.168.100.2/32   link#8             U       mvneta2
192.168.255.248/29 link#13            U      mvneta1.
192.168.255.249    link#13            UHS         lo0

Internet6:
Destination                       Gateway                       Flags     Netif Expire
default                           fe80::2c8:8bff:fed8:3419%mvneta2 UG   mvneta2
::1                               link#10                       UH          lo0
X:X:X::/64                link#8                        U       mvneta2
X:X:X::X                link#8                        UHS         lo0
X:X:X:X:X:X:X:X link#8                       UHS         lo0
X:X:X:X::/64           link#14                       U      mvneta1.
X:X:X:X:X:X:X:X link#14                   UHS         lo0
fe80::%mvneta1/64                 link#2                        U       mvneta1
fe80::208:a2ff:fe0c:c41c%mvneta1  link#2                        UHS         lo0
fe80::%mvneta2/64                 link#8                        U       mvneta2
fe80::208:a2ff:fe0c:c41d%mvneta2  link#8                        UHS         lo0
fe80::%lo0/64                     link#10                       U           lo0
fe80::1%lo0                       link#10                       UHS         lo0
fe80::%mvneta1.100/64             link#13                       U      mvneta1.
fe80::208:a2ff:fe0c:c41c%mvneta1.100 link#13                    UHS         lo0
fe80::%mvneta1.10/64              link#14                       U      mvneta1.
fe80::1:1%mvneta1.10              link#14                       UHS         lo0
fe80::208:a2ff:fe0c:c41c%mvneta1.10 link#14                     UHS         lo0
fe80::%mvneta1.20/64              link#15                       U      mvneta1.
fe80::208:a2ff:fe0c:c41c%mvneta1.20 link#15                     UHS         lo0
etherswitchcfg
21.02-RELEASE][root@pfsense.local.lan]/root: etherswitchcfg etherswitch0: VLAN mode: DOT1Q port1: pvid: 100 state=8<FORWARDING> flags=0<> media: Ethernet autoselect (1000baseT <full-duplex>) status: active port2: pvid: 100 state=8<FORWARDING> flags=0<> media: Ethernet autoselect (100baseTX <full-duplex>) status: active port3: pvid: 100 state=8<FORWARDING> flags=0<> media: Ethernet autoselect (1000baseT <full-duplex,master>) status: active port4: pvid: 1 state=8<FORWARDING> flags=0<> media: Ethernet autoselect (1000baseT <full-duplex>) status: active port5: pvid: 1 state=8<FORWARDING> flags=1<CPUPORT> media: Ethernet 2500Base-KX <full-duplex> status: active vlangroup0: vlan: 1 members 4,5 vlangroup1: vlan: 100 members 1,2,3,4t,5t vlangroup2: vlan: 10 members 4t,5t vlangroup3: vlan: 20 members 4t,5t -
@mcury Awesome find! It kinda makes sense as it was happening to me hourly. I have pfblockerng disable now. I do wonder if the corn schedule still kicks in?
EDIT: It does. I just had to reboot the box.
Looks like I have to find a way to disable the cron. -
+1 also experiencing the hang described here. Disabling pfBlockerNg helped.
-
Are you running the dev version of pfBlocker?
Does it 'lock up' as it's running the reload or once it's completed?
How large are you aliases/blocklists?
I have the non-dev package running and am not seeing that but only have limited dnsbl lists loaded.
Steve
-
@stephenw10 I am running pfBlockerNG-devel 3.0.0_10. The alias/blocklists are whatever is OOTB, I didn't customize anything.
By "lockup" I mean the LAN/WAN interfaces are completely unresponsive. Console access is fine.
P.S. I cross posted to this thread to make sure that @BBcan177 (the developer of pfBlockerNG) is aware.
-
@stephenw10 pfBlockerNG net 2.1.4_24
I do have several lists loading.
My Max table Entry is: 4000000Another thing I notice is that vnstad keeps crashing:
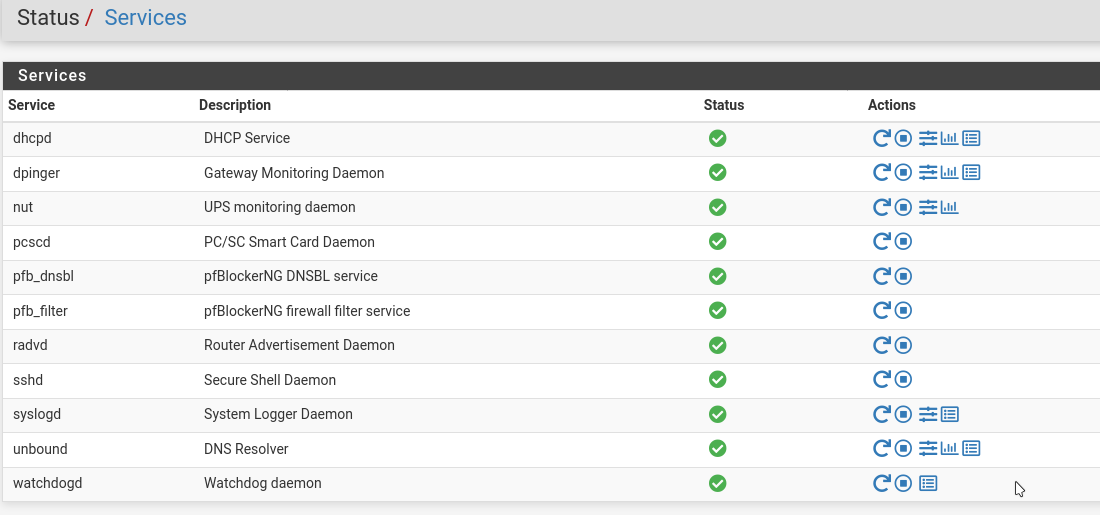
vnstatd Status Traffic Totals data collection daemon -
@stephenw10 said in 21.02 Sudden lockup:
Are you running the dev version of pfBlocker?
Does it 'lock up' as it's running the reload or once it's completed?
How large are you aliases/blocklists?
I have the non-dev package running and am not seeing that but only have limited dnsbl lists loaded.
Steve
Running the pfblockerng-devel 3.0.0_10, didn't customize anything, just ran the wizard, so it's a normal amount of aliases/blocklists.
No, it doesn't 'lock up' as it's running the reload or once it's completed, it finishes the process, and it's triggered if I reboot in this phase:Syncing OpenVPN settings...done.
Configuring firewall.Segmentation fault (core dumped) <<<
Starting CRON... done. -
Ah, OK so part way through the boot after loading the alises/lists?
Can you give us an idea of the numbers? I have:
===[ Native List IP Counts ] ===================================

    8513 total
    7311 /var/db/pfblockerng/native/Google.txt
     968 /var/db/pfblockerng/native/Spamhaus_drop.txt
     181 /var/db/pfblockerng/native/Facebook.txt
      53 /var/db/pfblockerng/native/Netflix.txt

===[ DNSBL Domain/IP Counts ] ===================================

   21346 total
   16998 /var/db/pfblockerng/dnsbl/Easylist_Default.txt
    4342 /var/db/pfblockerng/dnsbl/Easylist_Privacy.txt
       6 /var/db/pfblockerng/dnsbl/Custom_List_custom.txt
Steve
-
@stephenw10 said in 21.02 Sudden lockup:
Ah, OK so part way through the boot after loading the alises/lists?
Exactly.
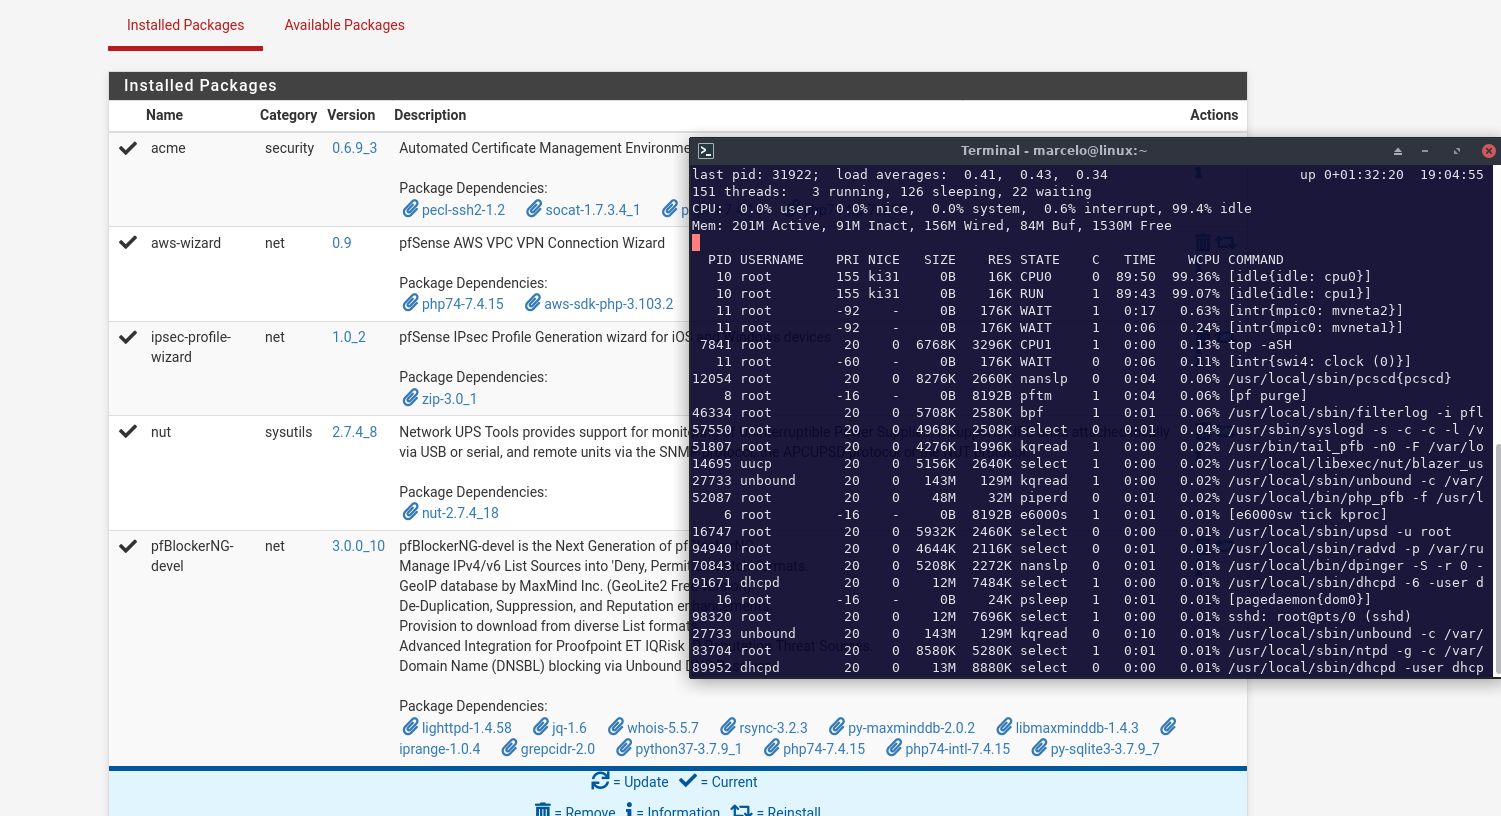
Packages installed: Acme, NUT, pfBlockerng-devel, aws-wizard, ipsec-profile-wizard.
It doesn't seem to be a memory issue:
===[ Deny List IP Counts ]===========================

   22138 total
   15000 /var/db/pfblockerng/deny/CINS_army_v4.txt
    4884 /var/db/pfblockerng/deny/ET_Comp_v4.txt
    1223 /var/db/pfblockerng/deny/ET_Block_v4.txt
     732 /var/db/pfblockerng/deny/Talos_BL_v4.txt
     118 /var/db/pfblockerng/deny/Abuse_Feodo_C2_v4.txt
      94 /var/db/pfblockerng/deny/Abuse_SSLBL_v4.txt
      76 /var/db/pfblockerng/deny/Spamhaus_eDrop_v4.txt
       8 /var/db/pfblockerng/deny/ISC_Block_v4.txt
       2 /var/db/pfblockerng/deny/Spamhaus_Drop_v4.txt
       1 /var/db/pfblockerng/deny/Abuse_IPBL_v4.txt

====================[ Empty Lists w/127.1.7.7 ]==================

Abuse_IPBL_v4.txt

===[ DNSBL Domain/IP Counts ] ===================================

  349821 total
  143310 /var/db/pfblockerng/dnsbl/Maltrail_BD.txt
  122595 /var/db/pfblockerng/dnsbl/C19_CTC.txt
   27951 /var/db/pfblockerng/dnsbl/SFS_Toxic_BD.txt
   13486 /var/db/pfblockerng/dnsbl/SWC.txt
   10871 /var/db/pfblockerng/dnsbl/EasyList.txt
    8913 /var/db/pfblockerng/dnsbl/Adaway.txt
    6999 /var/db/pfblockerng/dnsbl/Spam404.txt
    6671 /var/db/pfblockerng/dnsbl/MVPS.txt
    3031 /var/db/pfblockerng/dnsbl/EasyPrivacy.txt
    2500 /var/db/pfblockerng/dnsbl/D_Me_ADs.txt
    1986 /var/db/pfblockerng/dnsbl/Krisk_C19.txt
    1478 /var/db/pfblockerng/dnsbl/Yoyo.txt
      23 /var/db/pfblockerng/dnsbl/D_Me_Tracking.txt
       6 /var/db/pfblockerng/dnsbl/Juniper.txt
       1 /var/db/pfblockerng/dnsbl/D_Me_Malv.txt
       0 /var/db/pfblockerng/dnsbl/MDS_Immortal.fail
       0 /var/db/pfblockerng/dnsbl/MDS.fail
       0 /var/db/pfblockerng/dnsbl/MDL.txt
       0 /var/db/pfblockerng/dnsbl/D_Me_Malw.txt

====================[ IPv4/6 Last Updated List Summary ]==============

Feb 11	04:49	Spamhaus_eDrop_v4
Feb 17	02:30	ET_Block_v4
Feb 17	02:30	ET_Comp_v4
Feb 18	03:33	Spamhaus_Drop_v4
Feb 18	18:05	Talos_BL_v4
Feb 18	18:18	CINS_army_v4
Feb 18	18:39	ISC_Block_v4
Feb 18	18:55	Abuse_Feodo_C2_v4
Feb 18	18:55	Abuse_SSLBL_v4
Feb 18	19:01	Abuse_IPBL_v4

====================[ DNSBL Last Updated List Summary ]==============

Jul 31	2015	D_Me_Tracking
Sep 5	2018	Juniper
Jan 31	2020	D_Me_ADs
Jul 10	2020	D_Me_Malw
Jul 10	2020	D_Me_Malv
Nov 12	19:17	MDL
Dec 15	05:07	MVPS
Feb 15	02:18	Adaway
Feb 15	05:50	Yoyo
Feb 16	05:48	SWC
Feb 18	15:02	EasyPrivacy
Feb 18	15:30	Krisk_C19
Feb 18	17:50	C19_CTC
Feb 18	18:50	EasyList
Feb 18	19:00	SFS_Toxic_BD
Feb 18	19:00	Maltrail_BD
Feb 18	19:00	Spam404
===============================================================

Database Sanity check [  PASSED  ]
------------------------
Masterfile/Deny folder uniq check
Deny folder/Masterfile uniq check

Sync check (Pass=No IPs reported)
----------

Alias table IP Counts
-----------------------------
   22138 /var/db/aliastables/pfB_PRI1_v4.txt

pfSense Table Stats
-------------------
table-entries hard limit   400000
Table Usage Count         22164

 UPDATE PROCESS ENDED [ 02/18/21 19:01:58 ]
-
@stephenw10 My SG-3100 locked up again with pfblocker disabled. no cron running.
Unless the cron is running even though is been told to disable.
You guys have a bigger issue here. -
@mcury I don't think is a pfblocker issue TBH.
Mine keeps locking up even though is fully disabled, I am now going to uninstall it. -
@ffuentes Try to set the pfblocker cron settings to run once a day, instead of one hour to confirm if the problem will happen to you again.
Or completely remove the pfblockerng package. If it happens again even without the package installed (not only disabled). We will have a better understanding about it.. -
@mcury I just uninstalled it. Let see how far the rabbit holes go. :/