6100 Max: ISP Wan Ip Change Internet Loss - Requires Reboot
-
Hello all,
I have a 6100 MAX purchased in June that has, for lack of a better word crashed on my a few times since. The symptom is internet goes down of course. No DHCP, cant reach the portal. I can get in on serial line, but its non responsive, cant even reboot it from console. To resolve, i have to unplug it and restart. Note that restarting modem only has no affect.My setup is Arris S33 2.5Gbe port to 2.5Gbe on 6100 (labeled LAN1) WAN1 DAC to my unifi US8-150 spf.
Only logs i see in gateway are below, Oct 5 around 10AM is what the issue occurred, the time stamp below of course is after i rebooted. Looks like WAN address changed. I have "Skip rules when gateway is down." State killing on gateway failure has always been default, after last event I changed it to "Do not kill states on gateway failure"
The error below showed public ip changed from .1 to .185 after reboot. i always get teh alarm latency issue. Modem has a decent amount of correctable errors but power on channels looks good.
My question is how can I log or track the issue to figure out what is going on?
I have basic system with pfBlocker, have traffic shaping setup, 2 basic vlans and am on 23.05.1-RELEASE (amd64).
Logs
Oct 6 01:33:57 	dpinger 	6404 	WAN_DHCP XXXXX: Clear latency 12396us stddev 12651us loss 15%
Oct 6 01:32:16 	dpinger 	6404 	WAN_DHCP XXXXX: Alarm latency 13202us stddev 9951us loss 21%
Oct 5 22:50:38 	dpinger 	6404 	WAN_DHCP XXXXX: Clear latency 13001us stddev 13181us loss 9%
Oct 5 22:49:23 	dpinger 	6404 	WAN_DHCP XXXXX: Alarm latency 13214us stddev 13012us loss 22%
Oct 5 22:31:29 	dpinger 	6404 	WAN_DHCP XXXXX: Clear latency 11670us stddev 10051us loss 12%
Oct 5 22:27:31 	dpinger 	6404 	WAN_DHCP XXXXX: Alarm latency 13103us stddev 9960us loss 21%
Oct 5 18:44:54 	dpinger 	6404 	send_interval 500ms loss_interval 2000ms time_period 60000ms report_interval 0ms data_len 1 alert_interval 1000ms latency_alarm 500ms loss_alarm 20% alarm_hold 10000ms dest_addr xxxxxx bind_addr XXXXX identifier "WAN_DHCP "
Oct 5 18:44:54 	dpinger 	46104 	exiting on signal 15
Oct 5 18:44:49 	dpinger 	46104 	WAN_DHCP XXXXX: sendto error: 65
Oct 5 18:44:48 	dpinger 	46104 	WAN_DHCP XXXXX: sendto error: 65
Oct 5 18:44:48 	dpinger 	46104 	WAN_DHCP XXXXX: sendto error: 65
Oct 5 18:44:47 	dpinger 	46104 	WAN_DHCP XXXXX: sendto error: 65
Oct 5 18:43:22 	dpinger 	46104 	send_interval 500ms loss_interval 2000ms time_period 60000ms report_interval 0ms data_len 1 alert_interval 1000ms latency_alarm 500ms loss_alarm 20% alarm_hold 10000ms dest_addr XXXXX bind_addr XXXXX identifier "WAN_DHCP "
Oct 5 18:42:32 	dpinger 	52609 	exiting on signal 15
Edit - changed title font think crash was accurate
-
Does the serial console show nothing at all when you connect to it in that state?
You should try entering
ctl+t, that can show a hung process when nothing else does.Nothing in those logs look like anything other than connection issues on the WAN, which should not cause any issues for dhcp on LAN for example.
Do you have more than one gateway configured?
Steve
-
 S stephenw10 moved this topic from General pfSense Questions on
-
@stephenw10
Hi Steve,
Only default gateway, I just set it manually to WAN_DHCP in routing section and disabled gateway monitoring. It only happens every few weeks so very tough to catch.I will try the ctrl+t next time.
Thanks! -
Yeah if it only happens every few weeks that can be hard to diagnose. I'd suggest logging the console output but that might not be practical.
-
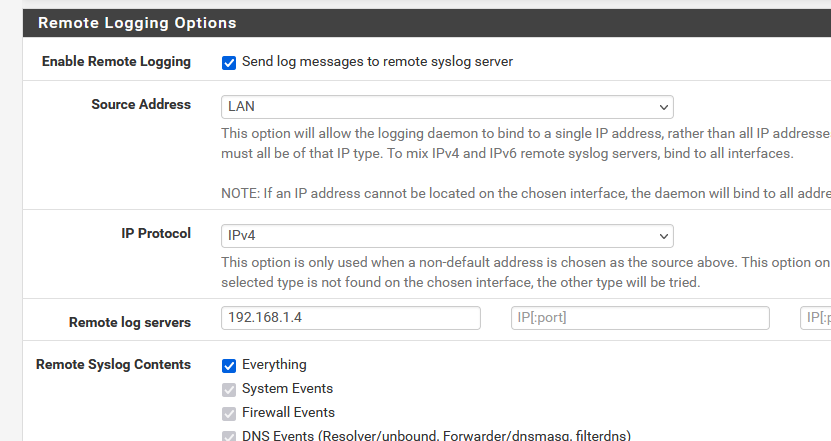
Hi Steve, i added remote logging to my synology nas using syslog-ng.
I used this parameter
{
file("/var/log/system.log");
};And it looks like its capturing system-general logs.
It is not capturing gateway logs or anything else. Do you think that's sufficient or how can I add more logs and what would you recommend? -
@stephenw10 said in 6100 Max Crashing?:
Yeah if it only happens every few weeks that can be hard to diagnose. I'd suggest logging the console output but that might not be practical.
What about

where 192.168.1.4 is your Syno nas ?
This will log everything ....
-
Yup, that can be a good option. A remote syslog server can catch errors if a local disk issue is preventing logging. However somethings only appear on the console if a device actually crashes.
-
I added that (Everything) but also just checked the others. I will see if that works.
Thanks!
-
Hope you are well. This issue occurred again today.
I got into the serial console, I tried ctl+t and didn't get anything out of it. I am sure I missed a command or something. That said, I rebooted normal in the serial interface and the 6100 did not come back up, let it sit for around 20 minutes and still nothing. I unplugged the 6100 and it came back up.
These are my logs I exported - When i got into the serial console before rebooting it showed a new WAN IP address and looks like this problem starts when this occurs and it cant come back up. The logs below are reflect the old WAN IP. I

Last event when this occurred I had gateway monitoring / action disabled. This time it was not selected and still happened.

I dont use a VPN or dynamic dns if that matters.
-
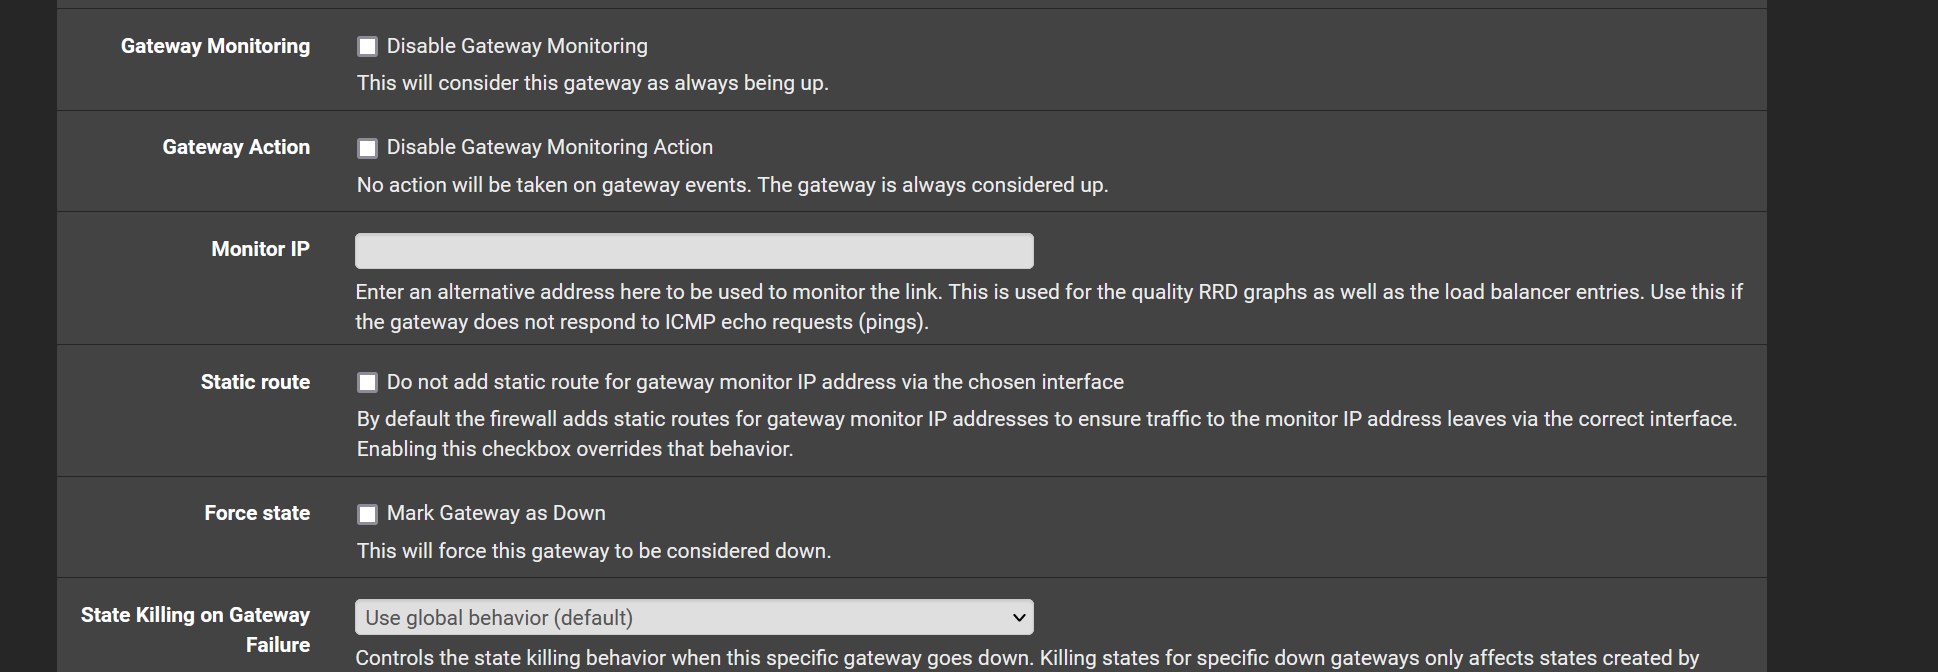
Goto System > Routing > Gateways > Edit
and at the bottom of the page, click on "Display Advanced".You'll find :

which means 'action' in undertaken as soon as more then 10 % is lost.
10 % lost means : 10 % of the ping packets didn't make it back. This might mean : (very) bad or overloaded WAN connection.
The action is : restart/reinit the AN connection.If 'someone' is throwing away constantly more then 10 % of your send ping requests, then it's understandable what you see is your logs : constantly reloading of the WAN interface.
Several options :
Change the settings, for example : accept more ICMP loss.
Pick another host for dpinger to ping to.
Stop the action all together :
Try repairing your uplink (check cables inside and outside)
Get a better ISP ^^ -
@Gertjan
Thanks for the response - everything is new from pole to house with no splitters and good power values. (Spectrum cable). Though there are a decent amount of errors and I’m sure there are problems with isp.This issue only occurs very infrequently, the last time was 21 days ago, with the time before that the same and it looks like it happens when isp changes wan ip.
-
Do you see SWAP enabled on the dashboard? That is required to store a crash report if it actually creates one.
-
No sir, it looks like I am not? How can I enable?
last pid: 32337; load averages: 0.22, 0.16, 0.11 up 0+19:11:58 05:35:30
60 processes: 1 running, 59 sleeping
CPU: 1.1% user, 0.1% nice, 2.2% system, 0.2% interrupt, 96.4% idle
Mem: 211M Active, 368M Inact, 903M Wired, 6304M Free
ARC: 287M Total, 94M MFU, 183M MRU, 16K Anon, 1683K Header, 8359K Other
244M Compressed, 689M Uncompressed, 2.82:1 Ratio -
Ah, interesting. OK check that a SWAP partition is defined. At the command line run:
gpart list -
@stephenw10
Here you goGeom name: nvd0 modified: false state: OK fwheads: 255 fwsectors: 63 last: 234441639 first: 3 entries: 4 scheme: GPT Providers: 1. Name: nvd0p1 Mediasize: 209715200 (200M) Sectorsize: 512 Stripesize: 0 Stripeoffset: 1536 Mode: r0w0e0 efimedia: HD(1,GPT,4792eff1-f262-11ec-8524-a1746a8b4cc2,0x3,0x64000) rawuuid: 4792eff1-f262-11ec-8524-a1746a8b4cc2 rawtype: c12a7328-f81f-11d2-ba4b-00a0c93ec93b label: (null) length: 209715200 offset: 1536 type: efi index: 1 end: 409602 start: 3 2. Name: nvd0p2 Mediasize: 113922309632 (106G) Sectorsize: 512 Stripesize: 0 Stripeoffset: 209716736 Mode: r1w1e1 efimedia: HD(2,GPT,4792eff7-f262-11ec-8524-a1746a8b4cc2,0x64003,0xd43263f) rawuuid: 4792eff7-f262-11ec-8524-a1746a8b4cc2 rawtype: 516e7cb6-6ecf-11d6-8ff8-00022d09712b label: (null) length: 113922309632 offset: 209716736 type: freebsd-ufs index: 2 end: 222914113 start: 409603 3. Name: nvd0p3 Mediasize: 5902090752 (5.5G) Sectorsize: 512 Stripesize: 0 Stripeoffset: 114132026368 Mode: r0w0e0 efimedia: HD(3,GPT,4ec35717-ac04-11ed-b9e8-90ec7762d5f6,0xd496642,0xafe561) rawuuid: 4ec35717-ac04-11ed-b9e8-90ec7762d5f6 rawtype: 516e7cb5-6ecf-11d6-8ff8-00022d09712b label: (null) length: 5902090752 offset: 114132026368 type: freebsd-swap index: 3 end: 234441634 start: 222914114 Consumers: 1. Name: nvd0 Mediasize: 120034123776 (112G) Sectorsize: 512 Mode: r1w1e2 -
Ok SWAP is present. Run:
cat /etc/fstab -
@stephenw10
Does this mean there is nothing?# Device Mountpoint FStype Options Dump Pass# /dev/msdosfs/EFISYS /boot/efi msdosfs rw,noatime,noauto 0 0 /dev/gptid/4ec35717-ac04-11ed-b9e8-90ec7762d5f6 none swap sw 0 0 -
Oh OK, that looks correct. Try running:
swapinfo -
Device 512-blocks Used Avail Capacity -
Hmm, odd.
Ok try changing that second line in /etc/fstab to:
/dev/nvd0p3 none swap sw 0 0Then reboot to apply that and check swapinfo again. Or it should be shown on the dashboard.