• Dpinger Gateway Monitor

    4
    0 Votes
    4 Posts
    751 Views
    F

    @FrankZappa Dennypage, thanks for the advice. I was able to edit the CSS file you referenced above and changed the color from the ugly blue (#009688) to a nicer green (#33EF0E). What I would really like to do is get rid of the colored box and just have the color of the letters coded e.g. online = green letters and offline = red letters.

    Anyway, for those of you interested in changing the color on the blue box in pfSense dark theme (which is probably just me), you need to edit lines 178, 337, and 343 in /usr/local/www/css/pfSense-dark.css. If you use a different theme, you will not have the same line numbers and it may be a different color on your Gateway widget. Change the background-color to whatever CSS code color you'd like (https://www.quackit.com/css/css_color_codes.cfm).

    I will play around with the CSS code to see if I can get rid of the box completely.

    Many thanks to dennypage.

    71c64a10-60d0-4a12-9292-bf4b966f04d4-image.png

  • Zabbix Agent v7

    3
    7 Votes
    3 Posts
    712 Views
    B

    We use it too.

  • ntopng 0.8.13_1 throws errors on syslog unable to fetch maxmind database

    10
    0 Votes
    10 Posts
    2k Views
    dennypageD

    @ha11oga11o FWIW, I don't work for Netgate, and I don't generally monitor the community version releases. As such, I'm not very knowledgeable on 2.7.2, but some quick googling shows that 2.7.2 was released in December of 2023, which was prior to the release of the updated ntopng package. I assume that the ntopng update will be included in the next community version, which appears to be 2.8.0, but perhaps someone more knowledgeable than I can comment on that.

  • Zeek Error.

    3
    2 Votes
    3 Posts
    872 Views
    M

    It looks like a bug was entered recently:
    https://redmine.pfsense.org/issues/15709

    I'm having the same issue, except the bug states that this only happens when you've selected "Check to mail connection summary reports each log rotation interval" in the ZeekControl settings; however, I don't have that enabled and still receive the notification.

    pfSense 2.7.2
    Zeek 3.0.6_4

  • BandwidthD not saving data?

    6
    0 Votes
    6 Posts
    1k Views
    U

    @pulsartiger That is probably why you didn't see much traffic when you were watching Youtube. Youtube uses IPV6 if available. I don't believe BandwidthD can currently track IPv6 traffic.

  • TLS Suspicious Extension

    18
    0 Votes
    18 Posts
    4k Views
    johnpozJ

    @pulsartiger shouldn't I changed mine from local.lan to home.arpa. Only other places I recall changing it was in host overrides I had setup for stuff on my network, and certs that I had created.

  • When will ntopng package be updated???

    26
    0 Votes
    26 Posts
    4k Views
    D

    @mvikman said in When will ntopng package be updated???:

    @denitrosubmena said in When will ntopng package be updated???:

    you mentioned not to monitor WAN but my question was how do i monitor multiple interfaces. read all my comments i was respectful and never said anything harsh but frustration came and am not i am still asking same question again and i even asked you directly.

    To be fair, in your pictures, the only interfaces are LAN and WAN, so it was a valid assumption that you want to monitor WAN and to warn you that it's not advisable.

    šŸ‘‰ https://forum.netgate.com/post/1182923

  • total traffic rollover in graph? error in total?

    8
    2 Votes
    8 Posts
    990 Views
    johnpozJ

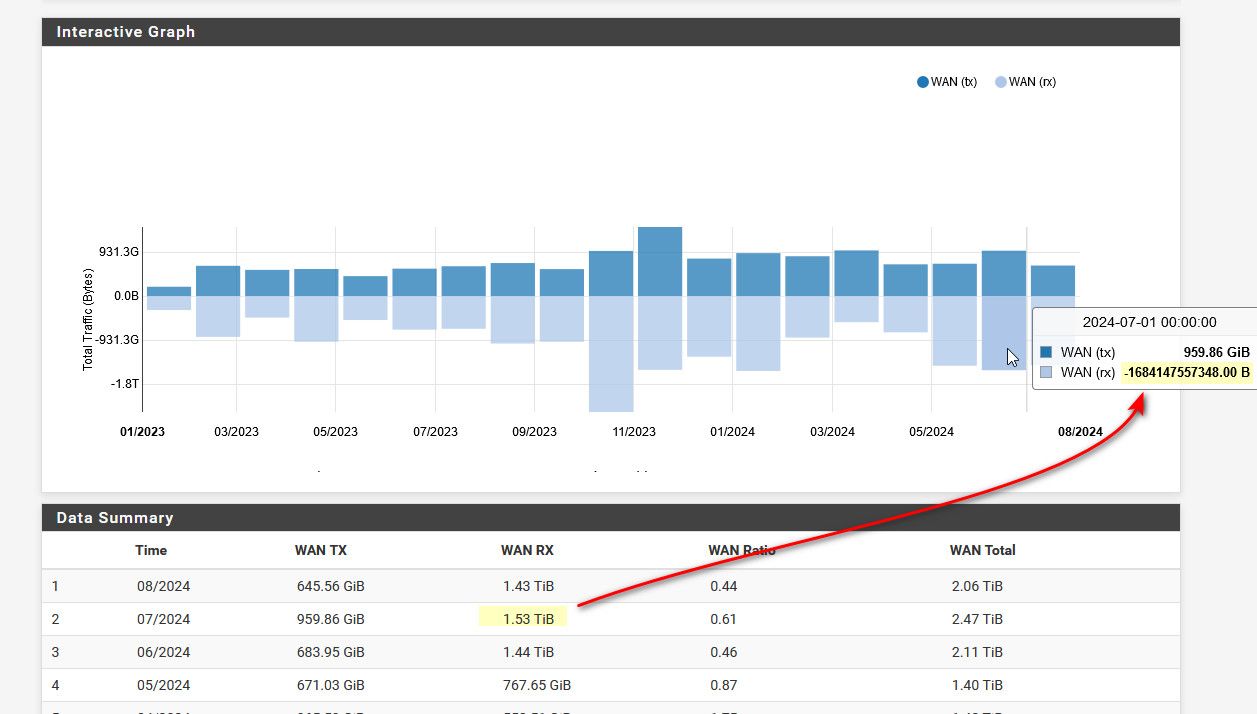
    @Sergei_Shablovsky Thanks for the confirmation. Yeah I took a quick fast look at the code.. And it seems the math that says when to convert it to a new SI looks like if >= 1000 to determine if needs to move up the scale etc... And the inverse or neg number doesn't trigger that..

    Not really a big deal to be sure - just bit of an eye sore.. is all.

  • SNGREP would be a great tool to have!

    9
    0 Votes
    9 Posts
    3k Views
    luckman212L

    Latest as of 2024-Aug is 1.7.0_1 (although the upstream github is at 1.8.2).

    Link: https://pkg.freebsd.org/FreeBSD:14:amd64/latest/All/sngrep-1.7.0_1.pkg

  • Telegraf configuration for influxdb 2

    3
    0 Votes
    3 Posts
    2k Views
    H

    I got it now "working" but telegraf unfortunately is not stable and stops working randomly. Until you get there you probably have tried a lot like me.

    I use this additional configuration. You can use that but there is a problem with: ^N (LF) Unix and the webinterface. If you open the configuration in "vi" you can see it.

    [[inputs.exec]] commands = [ "/usr/local/bin/telegraf_pfifgw.php", "sh /usr/local/bin/telegraf_temperature.sh" ] data_format = "influx" [[inputs.tail]] files = ["/var/log/pfblockerng/dnsbl.log"] data_format = "grok" from_beginning = false name_suffix = "_dnsbl_log" grok_timezone = "Local" grok_patterns = ["^%{WORD:blocktype}-%{WORD:blocksubtype},%{SYSLOGTIMESTAMP:timestamp:ts-syslog},%{IPORHOST:domain},%{IPORHOST:src_ip:tag},%{GREEDYDATA:req_agent},%{WORD:blockmethod},%{WORD:blocklist:tag},%{IPORHOST:tld:tag},%{WORD:feed_name:tag},%{GREEDYDATA:duplicateeventstatus}"] [[inputs.tail]] files = ["/var/log/pfblockerng/ip_block.log"] data_format = "grok" from_beginning = false name_suffix = "_ip_block_log" grok_timezone = "Local" grok_patterns = ["^%{SYSLOGTIMESTAMP:timestamp:ts-syslog},%{NUMBER:rulenum},%{DATA:interface},%{WORD:friendlyname},%{WORD:action},%{NUMBER:ip_version},%{NUMBER:protocolid},%{DATA:protocol:tag},%{IPORHOST:src_ip:tag},%{IPORHOST:dest_ip:tag},%{WORD:src_port:tag},%{NUMBER:dest_port:tag},%{WORD:direction},%{WORD:geoip_code:tag},%{DATA:ip_alias_name},%{DATA:ip_evaluated},%{DATA:feed_name:tag},%{HOSTNAME:resolvedhostname},%{GREEDYDATA:clienthostname},%{GREEDYDATA:ASN},%{GREEDYDATA:duplicateeventstatus}"] [[outputs.influxdb_v2]] urls = ["http://IPADRESS:8086"] token = "YOURTOKEN" organization = "NAME_OF_ORGANIZATION" bucket = "NAME_OF_BUCKET"

    Second problem if you only have a Influx DB V.2.0 you're temped to remove the login credentials for V.1.0 which is not a good idea because you recieve another error:

    2024-06-16T11:59:39Z E! [agent] Failed to connect to [outputs.influxdb], retrying in 15s, error was "unsupported scheme [\"\"]: \"\"" 2024-06-16T11:59:54Z E! [telegraf] Error running agent: connecting output outputs.influxdb: error connecting to output "outputs.influxdb": unsupported scheme [""]: ""

    If everything is correct then you still have the problem with random stops of Telegraf. I use the stable branch and no develop.
    I always recieve this in my debug log from Telegraf and then Telegraf needs a restart:

    2024-06-23T14:46:44Z E! [outputs.influxdb] E! [outputs.influxdb] Failed to write metric (will be dropped: 401 Unauthorized): 2024-06-23T14:46:44Z D! [outputs.influxdb] Wrote batch of 156 metrics in 6.772392ms 2024-06-23T14:46:44Z D! [outputs.influxdb] Buffer fullness: 1 / 10000 metrics 2024-06-23T14:46:45Z D! [outputs.influxdb_v2] Wrote batch of 156 metrics in 291.641419ms 2024-06-23T14:46:45Z D! [outputs.influxdb_v2] Buffer fullness: 2 / 10000 metrics 2024-06-23T14:46:54Z E! [outputs.influxdb] E! [outputs.influxdb] Failed to write metric (will be dropped: 401 Unauthorized): 2024-06-23T14:46:54Z D! [outputs.influxdb] Wrote batch of 147 metrics in 4.850251ms 2024-06-23T14:46:54Z D! [outputs.influxdb] Buffer fullness: 0 / 10000 metrics 2024-06-23T14:46:54Z D! [outputs.influxdb_v2] Wrote batch of 147 metrics in 41.016964ms 2024-06-23T14:46:54Z D! [outputs.influxdb_v2] Buffer fullness: 0 / 10000 metrics 2024-06-23T14:47:01Z D! [agent] Stopping service inputs 2024-06-23T14:47:01Z D! [inputs.tail] Recording offset 3289668 for "/var/log/pfblockerng/dnsbl.log" 2024-06-23T14:47:01Z D! [inputs.tail] Tail removed for "/var/log/pfblockerng/dnsbl.log" 2024-06-23T14:47:01Z D! [inputs.tail] Recording offset 189121 for "/var/log/pfblockerng/ip_block.log" 2024-06-23T14:47:01Z D! [inputs.tail] Tail removed for "/var/log/pfblockerng/ip_block.log" 2024-06-23T14:47:01Z D! [agent] Input channel closed 2024-06-23T14:47:01Z I! [agent] Hang on, flushing any cached metrics before shutdown 2024-06-23T14:47:01Z E! [outputs.influxdb] E! [outputs.influxdb] Failed to write metric (will be dropped: 401 Unauthorized): 2024-06-23T14:47:01Z D! [outputs.influxdb] Wrote batch of 117 metrics in 3.136646ms 2024-06-23T14:47:01Z D! [outputs.influxdb] Buffer fullness: 0 / 10000 metrics 2024-06-23T14:47:01Z D! [outputs.influxdb_v2] Wrote batch of 117 metrics in 22.786287ms 2024-06-23T14:47:01Z D! [outputs.influxdb_v2] Buffer fullness: 0 / 10000 metrics 2024-06-23T14:47:01Z I! [agent] Stopping running outputs 2024-06-23T14:47:01Z D! [agent] Stopped Successfully

    This error can happen after an hour or 30 Minutes or 3 hours. Maybe it has something to do with the files and PfblockerNG concerning read/write permissions.
    I also always see that the cpu is rising when it stops.

    Also I have this error in the log because I have Influx V.1.0 configured but i'm not using it.

    E! [outputs.influxdb] E! [outputs.influxdb] Failed to write metric (will be dropped: 401 Unauthorized):
  • Ntopng not working behind HAProxy with SSL Offload

    3
    1 Votes
    3 Posts
    2k Views
    tylereversT

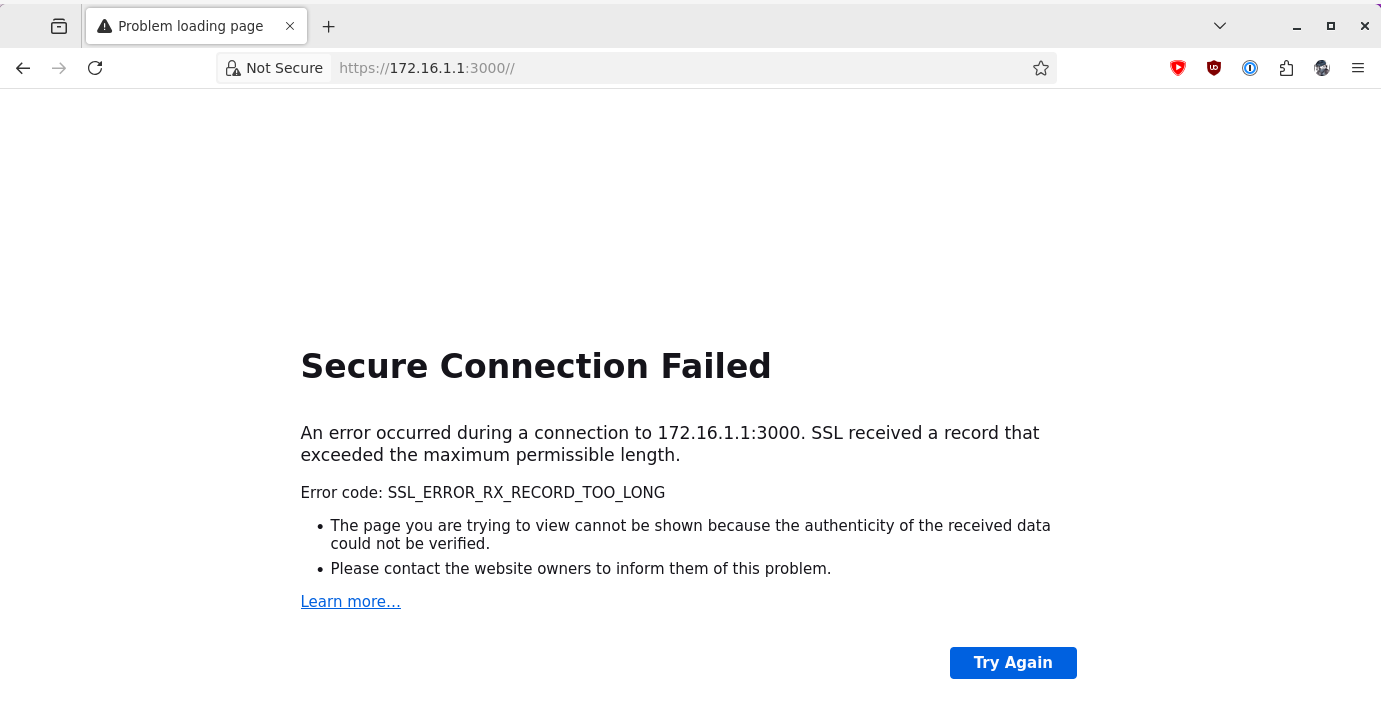
    @topkool @ProgressCity

    All - apologies for necro posting. I have battled this off and on for years and I always come back to this post in my searching and wanted to provide my
    best-so-far solution.

    I have discovered a temporary solution: modify the file (/usr/local/pkg/ntopng.inc) that is referenced during auto-generation (/usr/local/etc/rc.d/ntopng.sh) that creates the configuration for ntopng (/usr/local/etc/ntopng.conf).

    I have modified this part by swapping the lines below if and else.

    /* HTTP/HTTPS */ if (config_get_path('system/webgui/protocol') == "https") { unlink_if_exists(CERT_FILE); $config_lines = "--http-port=$listen_string\n"; } else { $cert = lookup_cert(config_get_path('system/webgui/ssl-certref')); ntopng_write_cert_file(CERT_FILE, $cert); $config_lines .= "--http-port=0\n--https-port=$listen_string\n"; }

    I was then able to configure pfSense HAProxy successfully.

    I suspect this will certainly not survive an upgrade/reinstall of the ntopng package, but it is more sustainable than the prior methods with the latest package version (says 5.6.0 in Package Manager, but installs 6.0.240423).

    If there is a better solution, please let me know. Thank you.

  • Softflowd not sending data

    9
    0 Votes
    9 Posts
    3k Views
    keyserK

    @alextg Consider upgrading to pfsense plus 24.03. It has a much better native netflow export feature where you can enable it on a rule by rule basis (or globally)

  • 0 Votes
    4 Posts
    746 Views
    C

    @ronv42 Thanks for the tip, I didn't know such a package exists.

  • [HOWTO]monitoring the system and network by netdata @pfSense Plus

    12
    1 Votes
    12 Posts
    3k Views
    R

    Has there been any progress with installing netdata without breaking pfSense?

  • ntopng + Status_Traffic_Totals no backup if /tmp + /var in RAM DISK

    5
    0 Votes
    5 Posts
    911 Views
    S

    @dennypage
    Thank you for your comment. Yes, I have an SSD (original) and I thought that setting it to "RAM" could also protect the SSD and thus let it live much longer.

    I had read something about this, but can't find it anymore

    EDIT
    well ... after some thought ja'i removed the "RAM" option and I'll see what happens next :-)

  • After 24.03 update VNSTAT no longer reporting on WireGuard interface

    2
    0 Votes
    2 Posts
    479 Views
    R

    Never mind, I was doing some maintenance this afternoon and I rebooted the router and then the WG_VPN interface was picked up by VNSTAT. Must have been a timing issue from the upgrade that VNSTAT didn't see the WG interface.

  • ntopng causing WAN interface to drop

    5
    0 Votes
    5 Posts
    855 Views
    D

    @dennypage Makes sense. I've disabled WAN and turned things back on. Will see if it happens again or is stable. Thanks for the info.

  • ARPWatch FlipFlop

    6
    0 Votes
    6 Posts
    2k Views
    johnpozJ

    @Technolust said in ARPWatch FlipFlop:

    but I would really like to know why Kali is reporting both NIC Card Mac addresses

    Get with Kali support or their forums.. Pfsense has nothing to do with what mac addresses something puts on the wire.. Arpwatch just reports what it sees.

    how about a simple ifconfig output from this kali box, it will show what mac address are listed for an interface.

    example - here is my nas that has multiple interfaces, and what mac they list for each instance of an interface.. It has multiples, running docker instances and running open vswitch for vms on it, etc.

    ash-4.4# ifconfig docker0 Link encap:Ethernet HWaddr 02:42:78:C0:11:CE inet addr:172.17.0.1 Bcast:172.17.255.255 Mask:255.255.0.0 UP BROADCAST RUNNING MULTICAST MTU:1500 Metric:1 RX packets:27465728 errors:0 dropped:0 overruns:0 frame:0 TX packets:25377979 errors:0 dropped:0 overruns:0 carrier:0 collisions:0 txqueuelen:1000 RX bytes:7155321949 (6.6 GiB) TX bytes:21376593584 (19.9 GiB) docker186 Link encap:Ethernet HWaddr A2:67:DD:19:CA:1F UP BROADCAST RUNNING MULTICAST MTU:1500 Metric:1 RX packets:6129118 errors:0 dropped:0 overruns:0 frame:0 TX packets:6001634 errors:0 dropped:0 overruns:0 carrier:0 collisions:0 txqueuelen:0 RX bytes:1837704920 (1.7 GiB) TX bytes:5085324938 (4.7 GiB) docker20b Link encap:Ethernet HWaddr 56:D8:D5:4C:EB:FC UP BROADCAST RUNNING MULTICAST MTU:1500 Metric:1 RX packets:15687 errors:0 dropped:0 overruns:0 frame:0 TX packets:18240 errors:0 dropped:0 overruns:0 carrier:0 collisions:0 txqueuelen:0 RX bytes:6228616 (5.9 MiB) TX bytes:43599547 (41.5 MiB) docker31b Link encap:Ethernet HWaddr 96:2C:75:39:15:E7 UP BROADCAST RUNNING MULTICAST MTU:1500 Metric:1 RX packets:169561 errors:0 dropped:0 overruns:0 frame:0 TX packets:391739 errors:0 dropped:0 overruns:0 carrier:0 collisions:0 txqueuelen:0 RX bytes:29968172 (28.5 MiB) TX bytes:986563196 (940.8 MiB) docker370 Link encap:Ethernet HWaddr 7E:78:87:D7:59:4B UP BROADCAST RUNNING MULTICAST MTU:1500 Metric:1 RX packets:453 errors:0 dropped:0 overruns:0 frame:0 TX packets:764 errors:0 dropped:0 overruns:0 carrier:0 collisions:0 txqueuelen:0 RX bytes:6244119 (5.9 MiB) TX bytes:90911 (88.7 KiB) docker4ce Link encap:Ethernet HWaddr 16:7A:43:EE:F4:12 UP BROADCAST RUNNING MULTICAST MTU:1500 Metric:1 RX packets:469 errors:0 dropped:0 overruns:0 frame:0 TX packets:771 errors:0 dropped:0 overruns:0 carrier:0 collisions:0 txqueuelen:0 RX bytes:1341275 (1.2 MiB) TX bytes:115507 (112.7 KiB) docker912 Link encap:Ethernet HWaddr 46:DE:B4:A8:8C:EB UP BROADCAST RUNNING MULTICAST MTU:1500 Metric:1 RX packets:351 errors:0 dropped:0 overruns:0 frame:0 TX packets:470 errors:0 dropped:0 overruns:0 carrier:0 collisions:0 txqueuelen:0 RX bytes:2882984 (2.7 MiB) TX bytes:76041 (74.2 KiB) dockerb04 Link encap:Ethernet HWaddr FE:76:AE:22:81:AF UP BROADCAST RUNNING MULTICAST MTU:1500 Metric:1 RX packets:14699786 errors:0 dropped:0 overruns:0 frame:0 TX packets:12747545 errors:0 dropped:0 overruns:0 carrier:0 collisions:0 txqueuelen:0 RX bytes:3199311528 (2.9 GiB) TX bytes:7503928522 (6.9 GiB) dockercae Link encap:Ethernet HWaddr 4E:66:60:17:BE:AE UP BROADCAST RUNNING MULTICAST MTU:1500 Metric:1 RX packets:91850 errors:0 dropped:0 overruns:0 frame:0 TX packets:145589 errors:0 dropped:0 overruns:0 carrier:0 collisions:0 txqueuelen:0 RX bytes:18155461 (17.3 MiB) TX bytes:159648970 (152.2 MiB) dockerf06 Link encap:Ethernet HWaddr FA:29:C2:0E:2A:84 UP BROADCAST RUNNING MULTICAST MTU:1500 Metric:1 RX packets:6492 errors:0 dropped:0 overruns:0 frame:0 TX packets:7026 errors:0 dropped:0 overruns:0 carrier:0 collisions:0 txqueuelen:0 RX bytes:16969805 (16.1 MiB) TX bytes:3162842 (3.0 MiB) eth0 Link encap:Ethernet HWaddr 00:11:32:7B:29:7D UP BROADCAST RUNNING SLAVE MULTICAST MTU:1500 Metric:1 RX packets:265420473 errors:3 dropped:0 overruns:0 frame:3 TX packets:1765623495 errors:0 dropped:0 overruns:0 carrier:0 collisions:0 txqueuelen:1000 RX bytes:70895377842 (66.0 GiB) TX bytes:2581175800785 (2.3 TiB) eth1 Link encap:Ethernet HWaddr 00:11:32:7B:29:7E UP BROADCAST RUNNING SLAVE MULTICAST MTU:1500 Metric:1 RX packets:25018342 errors:3 dropped:0 overruns:0 frame:3 TX packets:1443762 errors:0 dropped:0 overruns:0 carrier:0 collisions:0 txqueuelen:1000 RX bytes:15282717582 (14.2 GiB) TX bytes:154776134 (147.6 MiB) eth2 Link encap:Ethernet HWaddr A0:CE:C8:CC:57:AA UP BROADCAST RUNNING SLAVE MULTICAST MTU:1500 Metric:1 RX packets:934106059 errors:0 dropped:0 overruns:0 frame:0 TX packets:213838422 errors:0 dropped:0 overruns:0 carrier:0 collisions:0 txqueuelen:1000 RX bytes:1364844623928 (1.2 TiB) TX bytes:252703732636 (235.3 GiB) lo Link encap:Local Loopback inet addr:127.0.0.1 Mask:255.0.0.0 UP LOOPBACK RUNNING MTU:65536 Metric:1 RX packets:179040222 errors:0 dropped:0 overruns:0 frame:0 TX packets:179040222 errors:0 dropped:0 overruns:0 carrier:0 collisions:0 txqueuelen:1 RX bytes:51348338307 (47.8 GiB) TX bytes:51348338307 (47.8 GiB) ovs_eth0 Link encap:Ethernet HWaddr 00:11:32:7B:29:7D inet addr:192.168.9.10 Bcast:192.168.9.255 Mask:255.255.255.0 UP BROADCAST RUNNING MULTICAST MTU:1500 Metric:1 RX packets:222736950 errors:0 dropped:0 overruns:0 frame:0 TX packets:593494311 errors:0 dropped:0 overruns:0 carrier:0 collisions:0 txqueuelen:1 RX bytes:52112776572 (48.5 GiB) TX bytes:2502798699286 (2.2 TiB) ovs_eth1 Link encap:Ethernet HWaddr 00:11:32:7B:29:7E inet addr:192.168.9.11 Bcast:192.168.9.255 Mask:255.255.255.0 UP BROADCAST RUNNING MULTICAST MTU:1500 Metric:1 RX packets:994257 errors:0 dropped:57 overruns:0 frame:0 TX packets:1307475 errors:0 dropped:0 overruns:0 carrier:0 collisions:0 txqueuelen:1 RX bytes:9333479066 (8.6 GiB) TX bytes:145641239 (138.8 MiB) ovs_eth2 Link encap:Ethernet HWaddr A0:CE:C8:CC:57:AA inet addr:192.168.10.10 Bcast:192.168.10.255 Mask:255.255.255.0 UP BROADCAST RUNNING MULTICAST MTU:1500 Metric:1 RX packets:118693348 errors:0 dropped:0 overruns:0 frame:0 TX packets:54479729 errors:0 dropped:0 overruns:0 carrier:0 collisions:0 txqueuelen:1 RX bytes:1332228115488 (1.2 TiB) TX bytes:244367874136 (227.5 GiB) tap021132 Link encap:Ethernet HWaddr 26:77:DB:5D:C3:FD UP BROADCAST RUNNING SLAVE MULTICAST MTU:1500 Metric:1 RX packets:3483 errors:0 dropped:0 overruns:0 frame:0 TX packets:11280 errors:0 dropped:0 overruns:0 carrier:0 collisions:0 txqueuelen:1000 RX bytes:2638777 (2.5 MiB) TX bytes:1720089 (1.6 MiB) tap021132 Link encap:Ethernet HWaddr 16:59:FE:98:2C:BF UP BROADCAST RUNNING SLAVE MULTICAST MTU:1500 Metric:1 RX packets:132802 errors:0 dropped:0 overruns:0 frame:0 TX packets:231258 errors:0 dropped:0 overruns:0 carrier:0 collisions:0 txqueuelen:1000 RX bytes:6496010 (6.1 MiB) TX bytes:72501950 (69.1 MiB) tap021132 Link encap:Ethernet HWaddr 22:1F:B0:1A:C6:48 UP BROADCAST RUNNING SLAVE MULTICAST MTU:1500 Metric:1 RX packets:11917628 errors:0 dropped:0 overruns:0 frame:0 TX packets:19614033 errors:0 dropped:0 overruns:0 carrier:0 collisions:0 txqueuelen:1000 RX bytes:2237893739 (2.0 GiB) TX bytes:14333236286 (13.3 GiB) ash-4.4#
  • ntopng password length limit

    2
    0 Votes
    2 Posts
    493 Views
    dennypageD

    @jon-mck I’d have to look at the ntopng code itself, but there is no limit in the pfSense package.

    You can also experiment with setting the password from inside of ntopng to see if it puts out an indication of requirements.

  • ntopng stopping/exiting/crashing

    9
    0 Votes
    9 Posts
    2k Views
    dennypageD

    @Lockie said in ntopng stopping/exiting/crashing:

    Turned off Network Discovery.

    This could very well have been the issue. The Active Network Discovery code is not the most commonly used code in ntopng.

Copyright 2025 Rubicon Communications LLC (Netgate). All rights reserved.